Skip to product menu
close
EXPLORE ALL PRODUCTS

Sales

CRM

Comprehensive CRM platform for customer-facing teams.

CRM
Voice

Cloud Contact Center Software for businesses.

Voice
Sign

Digital signature app for businesses.

Sign
Forms

Build online forms for every business need.

Forms
Bigin

Simple CRM for small businesses moving from spreadsheets.

Bigin
SalesIQ

Live chat app to engage and convert website visitors.

SalesIQ
Bookings

Appointment scheduling app for consultations with customers.

Bookings
RouteIQ

AI-powered ETL tool for effective data integration and movement.

RouteIQ
Thrive

Complete loyalty and affiliate management platform.

Thrive
Suites
CRM Plus

Unified platform to deliver top-notch customer experience.

CRM Plus

Marketing

Campaigns

Create, send, and track targeted email campaigns that drive sales.

Campaigns
Voice

Cloud Contact Center Software for businesses.

Voice
Sign

Digital signature app for businesses.

Sign
Forms

Build online forms for every business need.

Forms
Social

All-in-one social media management software.

Social
Survey

Design surveys to reach and interact with your audience.

Survey
SalesIQ

Live chat app to engage and convert website visitors.

SalesIQ
Sites

Online website builder with extensive customisation options.

Sites
Backstage

End-to-end event management software.

Backstage
PageSense

Website conversion optimization and personalisation platform.

PageSense
Marketing Automation

All-in-one marketing automation software.

Marketing Automation
LandingPage

Smart landing page builder to increase conversion rates

LandingPage
Webinar

Webinar platform for webcasting online webinars.

Webinar
NEW
LeadChain

Sync, manage, and convert leads across channels seamlessly.

LeadChain
NEW
Domains

Easy domain registration, transfer, and secured DNS management.

Domains
NEW
CommunitySpaces

Online community platform for individuals and businesses to grow their network and brand.

CommunitySpaces
Thrive

Complete loyalty and affiliate management platform.

Thrive
Publish

Manage all your local business listings on a single platform.

Publish
Suites
Marketing Plus

Unified marketing platform for marketing teams.

Marketing Plus

Commerce and POS

Commerce

eCommerce platform to manage and market your online store.

Commerce

Service

Desk

Helpdesk software to deliver great customer support.

Desk
Assist

Remote support and unattended remote access software.

Assist
Voice

Cloud Contact Center Software for businesses.

Voice
SalesIQ

Live chat app to engage and convert website visitors.

SalesIQ
Bookings

Appointment scheduling app for consultations with customers.

Bookings
FSM

End-to-end field service management platform for service businesses.

FSM
Lens

Interactive remote assistance software with augmented reality.

Lens
Solo

The all-in-one toolkit for solopreneurs.

Solo
Suites
Service Plus

Unified platform for customer service and support teams.

Service Plus

Finance

Books

Powerful accounting platform for growing businesses.

Books
Expense

Effortless expense reporting platform.

Expense
Sign

Digital signature app for businesses.

Sign
Inventory

Powerful stock management and inventory control software.

Inventory
FREE
Invoice

100% Free invoicing solution.

Invoice
Billing

End-to-end billing solution for your business.

Billing
NEW
Payroll

Payroll software with automated tax payments and filing.

Payroll
Commerce

eCommerce platform to manage and market your online store.

Commerce
Checkout

Collect payments online with custom branded pages.

Checkout
Practice

Practice management software for accounting firms.

Practice
Solo

The all-in-one toolkit for solopreneurs.

Solo
NEW
Payments

Unified payment solution built for all businesses.

Payments
Suites
Finance Plus

All-in-one suite to manage your operations and finances.

Finance Plus

Email, Storage, and Collaboration

Mail

Secure email service for teams of all sizes.

Mail
Voice

Cloud Contact Center Software for businesses.

Voice
Sign

Digital signature app for businesses.

Sign
WorkDrive

Online file management for teams.

WorkDrive
Bookings

Appointment scheduling app for consultations with customers.

Bookings
Cliq

Stay in touch with teams no matter where you are.

Cliq
Notebook

Beautiful home for all your notes.

Notebook
Meeting

Online meeting software for all your video conferencing & webinar needs.

Meeting
Connect

Employee experience platform to communicate, engage, and build positive employee relations.

Connect
Learn

Knowledge and learning management platform.

Learn
Office Integrator

Built in document editors for web apps.

Office Integrator
Writer

Word processor for focused writing and discussions.

Writer
TeamInbox

Shared inboxes for teams.

TeamInbox
ZeptoMail

Secure and reliable transactional email sending service.

ZeptoMail
Show

Create, edit, and share slides with a sleek presentation app.

Show
Tables

Work management tool to connect people, processes, and information.

Tables
Sheet

Spreadsheet software for collaborative teams.

Sheet
Office Suite

Powerful collaborative work platform for teams.

Office Suite
Calendar

Online business calendar to manage events and schedule appointments.

Calendar
ToDo

Collaborative task management for individuals and teams.

ToDo
FREE
PDF Editor

Collaborative online PDF editing tool.

PDF Editor
Suites
Workplace

Application suite built to improve team productivity and collaboration.

Workplace

Human Resources

Expense

Effortless expense reporting platform.

Expense
Recruit

Intuitive recruiting platform built to provide hiring solutions.

Recruit
People

Organize, automate, and simplify your HR processes.

People
Sign

Digital signature app for businesses.

Sign
NEW
Payroll

Payroll software with automated tax payments and filing.

Payroll
Shifts

Employee scheduling and time tracking app.

Shifts
Workerly

Manage temporary staffing with an employee scheduling solution.

Workerly
Suites
People Plus

Comprehensive HR platform for seamless employee experiences.

People Plus

Security and IT Management

Creator

Build custom apps to simplify business processes.

Creator
Assist

Remote support and unattended remote access software.

Assist
Vault

Online password manager for teams.

Vault
Directory

Workforce identity and access management solution for cloud businesses.

Directory
Lens

Interactive remote assistance software with augmented reality.

Lens
QEngine

Test automation software to build, manage, execute, and report testcases.

QEngine
Catalyst

Pro-code platform to build and deploy your apps.

Catalyst
RPA

Automate manual, tedious, and repetitive tasks easily.

RPA
NEW
eProtect

Comprehensive email security and archiving for every business.

eProtect
FREE
OneAuth

Secure multi-factor authenticator (MFA) for all your online accounts.

OneAuth
Toolkit

Complete resource for any admin-related lookup queries.

Toolkit

BI and Analytics

Analytics

Modern self-service BI and analytics platform.

Analytics
DataPrep

AI-powered data preparation service for your data-driven organization.

DataPrep
NEW
IoT

Harnessing IoT analytics for real-time operational intelligence.

IoT
Embedded BI

Embedded analytics and white label BI solutions, tailored for your needs.

Embedded BI

Project Management

Projects

Manage, track, and collaborate on projects with teams.

Projects
Sprints

Planning and tracking tool for scrum teams.

Sprints
BugTracker

Automatic bug tracking software for managing bugs.

BugTracker
Solo

The all-in-one toolkit for solopreneurs.

Solo
Suites
Projects Plus

Unified project management platform for intelligent, data-driven work.

Projects Plus

Developer Platforms

Creator

Build custom apps to simplify business processes.

Creator
Flow

Automate business workflows by creating smart integrations.

Flow
Office Integrator

Built in document editors for web apps.

Office Integrator
DataPrep

AI-powered data preparation service for your data-driven organization.

DataPrep
ZeptoMail

Secure and reliable transactional email sending service.

ZeptoMail
Tables

Work management tool to connect people, processes, and information.

Tables
QEngine

Test automation software to build, manage, execute, and report testcases.

QEngine
Catalyst

Pro-code platform to build and deploy your apps.

Catalyst
RPA

Automate manual, tedious, and repetitive tasks easily.

RPA
NEW
IoT

Build, deploy, and scale IoT solutions for connected businesses.

IoT
Apptics

Application analytics for all apps.

Apptics
Embedded BI

Embedded analytics and white label BI solutions, tailored for your needs.

Embedded BI

IoT

NEW
IoT

Low-code IoT platform and solutions for connected businesses.

IoT
CRM Plus

Unified platform to deliver top-notch customer experience.

Try now
CRM Plus
Service Plus

Unified platform for customer service and support teams.

Try now
Service Plus
Finance Plus

All-in-one suite to manage your operations and finances.

Try now
Finance Plus
People Plus

Comprehensive HR platform for seamless employee experiences.

Try now
People Plus
Workplace

Application suite built to improve team productivity and collaboration.

Try now
Workplace
Marketing Plus

Unified marketing platform for marketing teams.

Try now
Marketing Plus
Projects Plus

Unified project management platform for intelligent, data-driven work.

Try now
Projects Plus
All-in-one suite

Zoho One

The Operating System for Business

Run your entire business on Zoho with our unified cloud software, designed to help you break down silos between departments and increase organizational efficiency.

TRY ZOHO ONE
Zoho Marketplace

With over 2000 ready-to-use extensions across 40+ categories, connect your favorite business tools with the Zoho products you already use.

EXPLORE MARKETPLACE

Zoho Analytics has been recognized in the 2025 Gartner® Magic Quadrant™ for ABI Platforms.Read more

Skip to main content

Trend Line

Trend Lines are used to identify the trend present in your data. Zoho Analytics can plot the past & future trends in your time series or number series data.  Zoho Analytics provides five such models to derive the Trend Line. 

  1. What are Trend Lines?
  2. How are Trend Lines derived? 
  3. What are the models supported in Zoho Analytics for predicting the Trend line?
  4. What are the chart types that support Trend Line?
  5. Who can add a Trend Line for the chart?
  6. What is the prerequisite to add a Trend Line in a chart?
  7. How to add a Trend Line for my chart?
  8. Can I view how my Trend Line model is applied?
  9. Can I set up a Trend Line for forecasted data?
  10. What is Confidence Line and how do I add this for my Trend Line?
  11. Can I set up a Trend Line over multiple Y-Axes?
  12. Can I set up a Trend Line over a chart with legend?
  13. Trend Line option is not available in my chart, why?
  14. Can my Shared Users view the Trend Line?
  15. Can I Export Trend Line data?

1. What are Trend Lines?

Trend Line are used to identify the trends present in your data. Zoho Analytics predicts the Trend line for data in time or number series.

2. How are Trend Lines derived? 

Trend Lines can be derived based on various mathematical models. Zoho Analytics provides five models to derive the Trend line. They are Linear, Logarithmic, Exponential, Power, and Polynomial. 

  • Based on the model selected, along with the data from the chart, possible trend values will be predicted.
  • Error square will be identified by calculating the square of the difference between the actual Y and predicted trend Y value. 
  • The above process will be repeated by changing the parameters and checking whether the error square is reduced. 
  • The Trend Line will be plotted with the value where the error square is the least.

3. What are the models supported in Zoho Analytics for predicting the Trend line?

Zoho Analytics supports the following models to predict the Trend Line.

  • Linear - Choose to apply a Linear model to derive the Trend Line.
  • Logarithmic - Choose this to apply a Logarithmic model to derive the Trend Line. Not best suited if data points have negative values.
  • Exponential - Chose this to apply an Exponential model to derive the Trend Line.
  • Power - Chose this to apply a Power factor model to derive the Trend Line. This is another form of Exponential model where the natural log is applied on factors before applying exponential.
  • Polynomial - Chose to apply a Polynomial model to derive the Trend Line. The degree value provided is used to derive a polynomial series for the specified degree.
  • Auto - Choose this to allow Zoho Analytics to select the best Trend Line model based on the given data points.

4. What are the chart types that support the Trend Line?

‌The following chart types support Trend Line.

  • Line Chart
  • Bar Chart
  • Stacked Bar Chart
  • Scatter Chart
  • Area Chart
  • Stacked Area Chart
  • Bubble Chart (not Bubble Pie and Packed Bubble)
  • Combo Charts 

 5. Who can add a Trend Line for the chart?

Trend Line is available in all plans of Zoho Analytics including the free plan. 

Users who can create the chart can add a Trend line for the chart. 

6. What is the Prerequisite to add a Trend Line in the chart?

The following are the prerequisites to add a Trend Line in the chart. 

  • The X-Axis should have a Time, Date, or Number series.
  • The Y-Axis should have one or more aggregate columns or a single measure column.

7. How to add a Trend Line for my chart?

8. Can I view how my Trend Line model is applied?

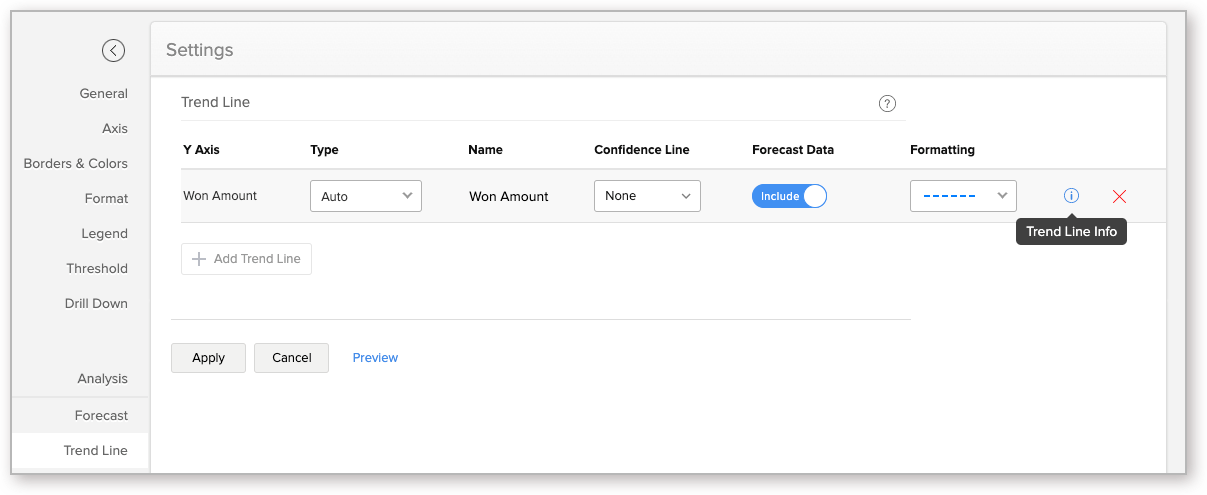
Yes, you can view how the Trend Line model is applied over your chart. To view the information, click the info icon in the Trend Line legend

You can also view the Trend Line model from the Settings page. Open the Trend Line tab and click the info icon. 
The Trend Line Model dialog will open displaying the following information.
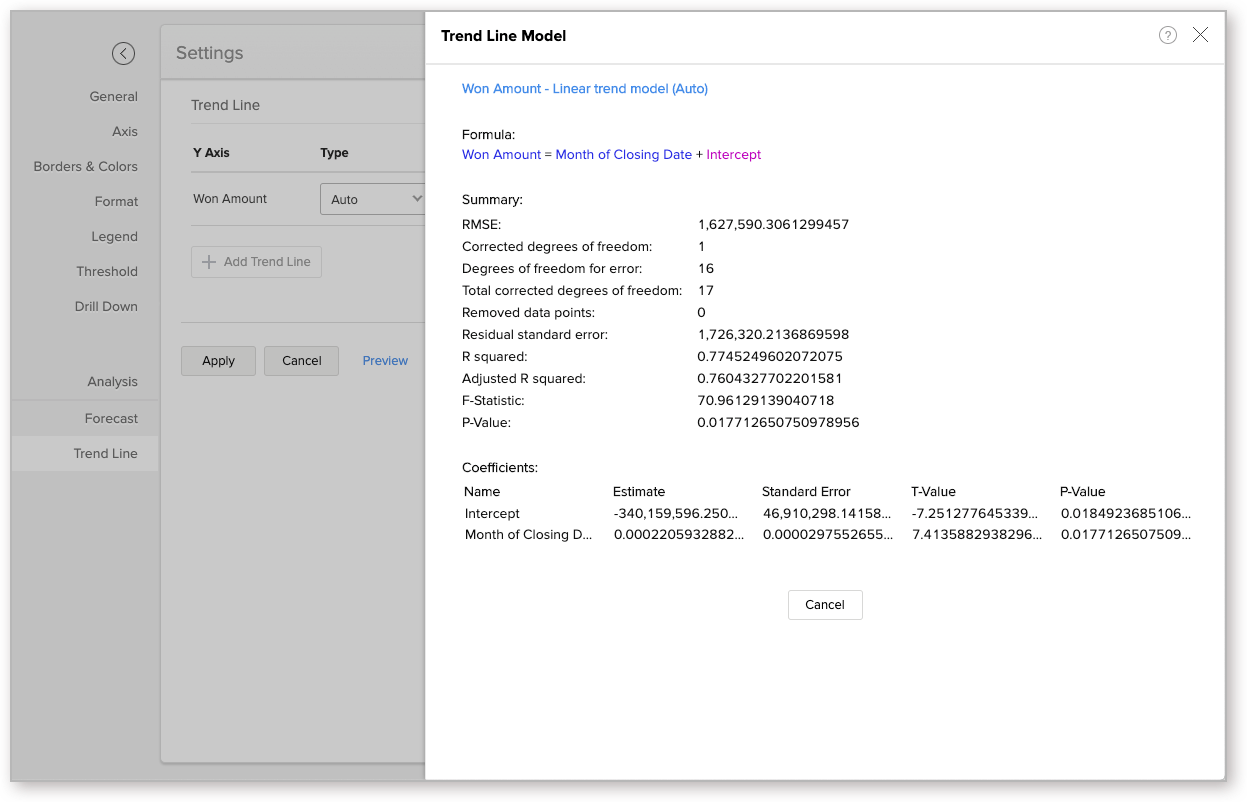
Formula 

This section displays the formula applied over the chart to drive the Trend Line.  

Model Summary

This section displays the model summary. 
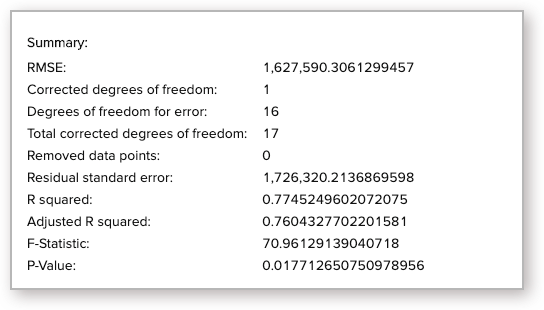
  • RMSE - Root Mean Square Error shows how concentrated the data is around the Trend Line. To calculate this, the error2 will be divided by the Mean and then the square root of the result will be calculated.  
  • Corrected degrees of freedom - This displays the number of coefficients minus 1. The value will be 1 for all models except for Polynomial. 
  • Degrees of freedom for error - This displays the number of data points that are included in calculating the Trend Line minus the number of coefficients.
  • Total corrected degrees of freedom - This displays the number of data points that are included in calculating the Trend Line minus 1. 
  • Removed data points - Number of data points that are eliminated while calculating the Trend Line. Avoid using a model that discards more data points unless you know that they are invalid. 
  • Residual standard error - Here error2 will be divided by the corrected degrees of freedom. 
  • R squared - This indicates how better the trend fits in the model. A line for the average of the data will be plotted. The average is divided by the error2. If the result is approximately equal to 1, then the data fits the model. 
  • Adjusted R squared - This ensures that the model does not overfit.  This reduces the metric by the number of parameters in the model. If the result is approximately equal to 1, then the data fits the model. 
  • F-Statistic - This shows how far the X value influences the trend. The higher the value the more X value contributes to the trend. 
  • P-Value - This shows the probability of the estimator not contributing for the data. This indicated the significance of the Coefficients. The smaller the p-value, the more significant the model is.

Coefficients

This section displays the significance of the Coefficients.

  • Name - Name of the components.
  • Estimate - The estimated value of the coefficient for the corresponding components.
  • Standard Error - This shows the possibility of error for the coefficient.
  • T-Value - This shows the estimated value divided by the Standard Error.  A higher value indicates how better the model fits. 
  • P-Value - This indicates how helpful the corresponding parameter is in creating the model.

9. Can I set up a Trend Line for forecasted data?

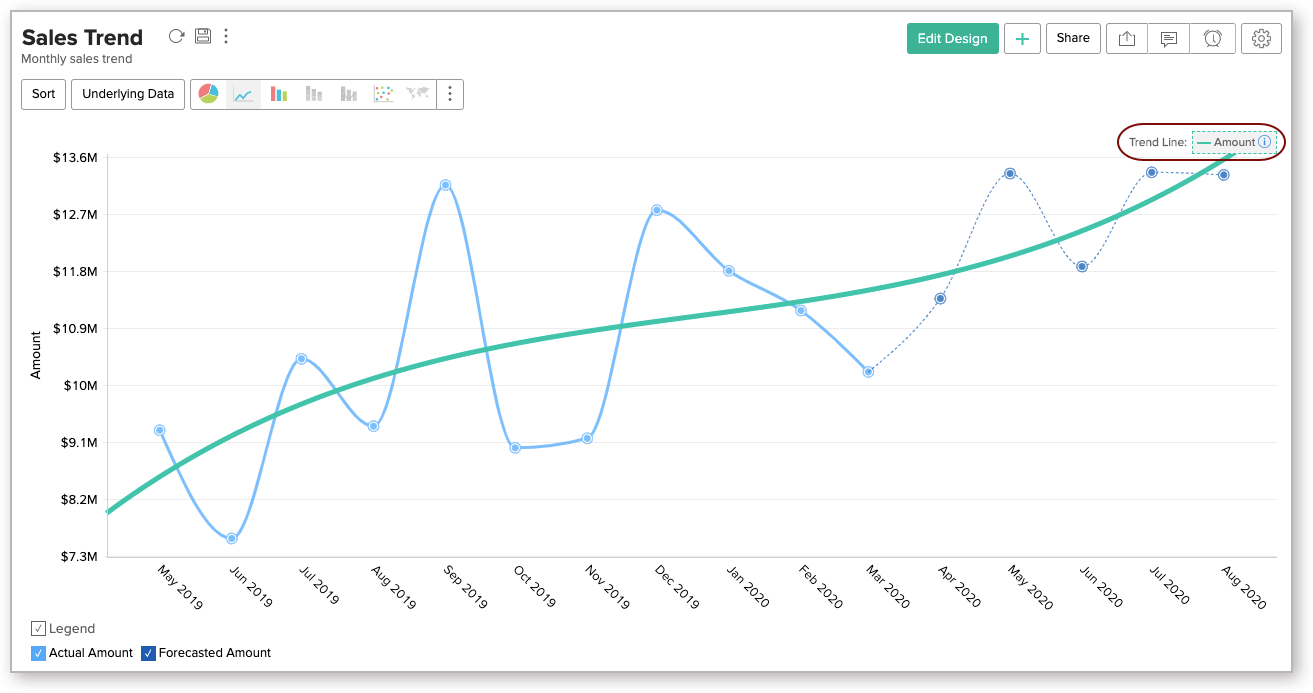
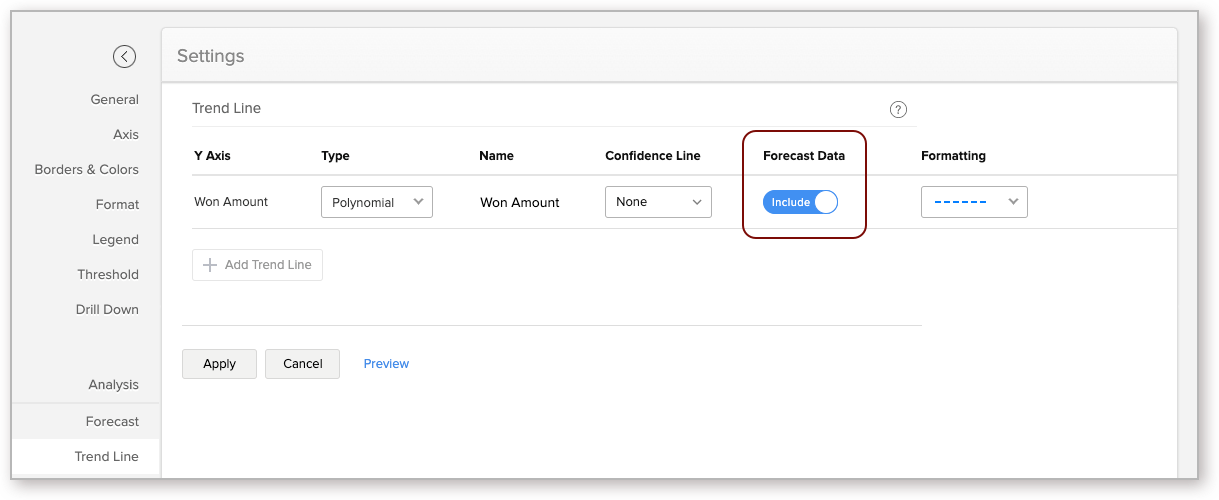
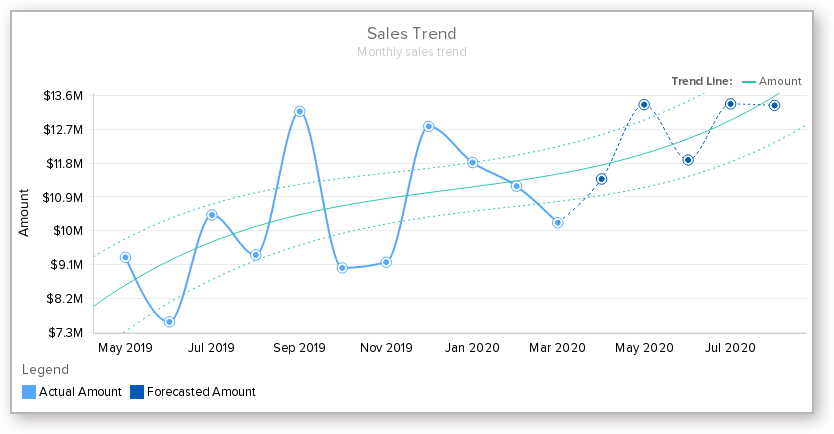
Yes, you can predict the Trend Line for forecasted data. To include trend line for forecasted data for Trend Line calculation, set the Forecast Data toggle button as Include.
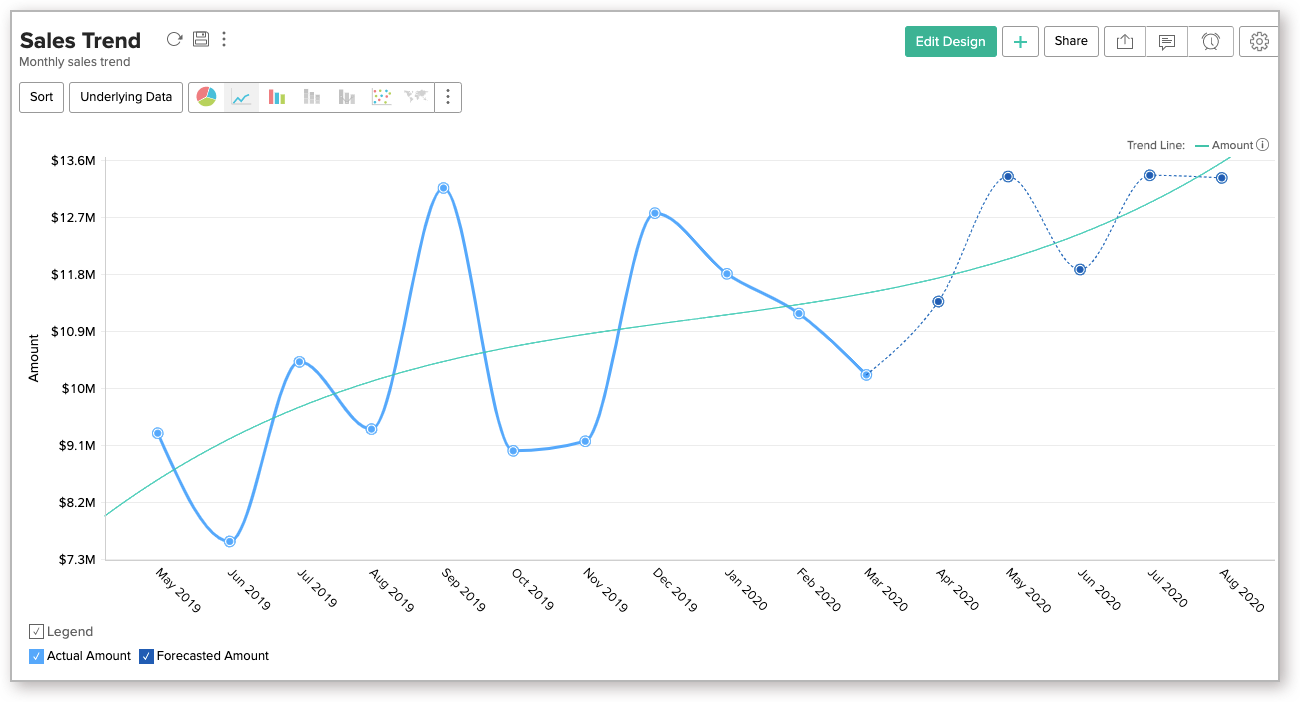
The following illustration shows the Trend Line for forecasted data.     
10. What is Confidence Line and how do I add this for my Trend line?

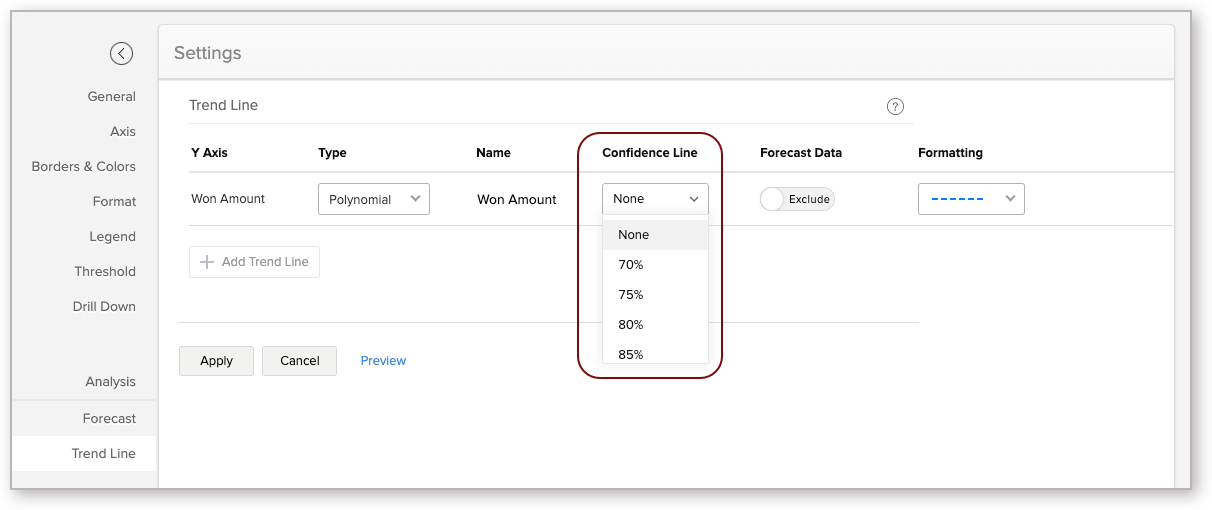
The Confidence Line predicts what the Trend Line can be for a similar data set for the given probability. You can select the probability range in the Confidence Line from 70% to 95%.  
‌The below chart is drawn with a 90% confidence range. i.e., when you change the underlying data with a similar data set (populated with the same conditions), then the Trend Line will be 90% within this Confidence Line.

11. Can I set up a Trend Line over multiple Y-Axes?

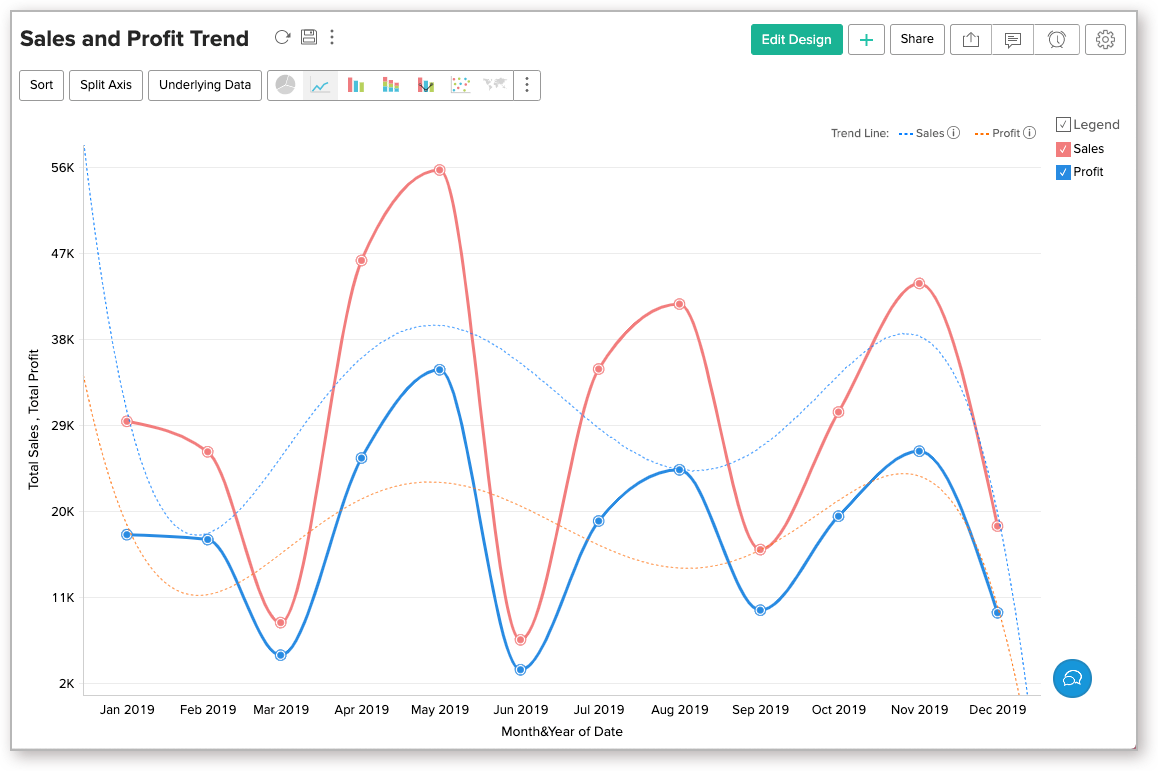
Yes, you can plot the trend for a chart with multiple aggregate columns in Y-Axes. The Trend Line can be drawn up to 5 Y-Axes. 
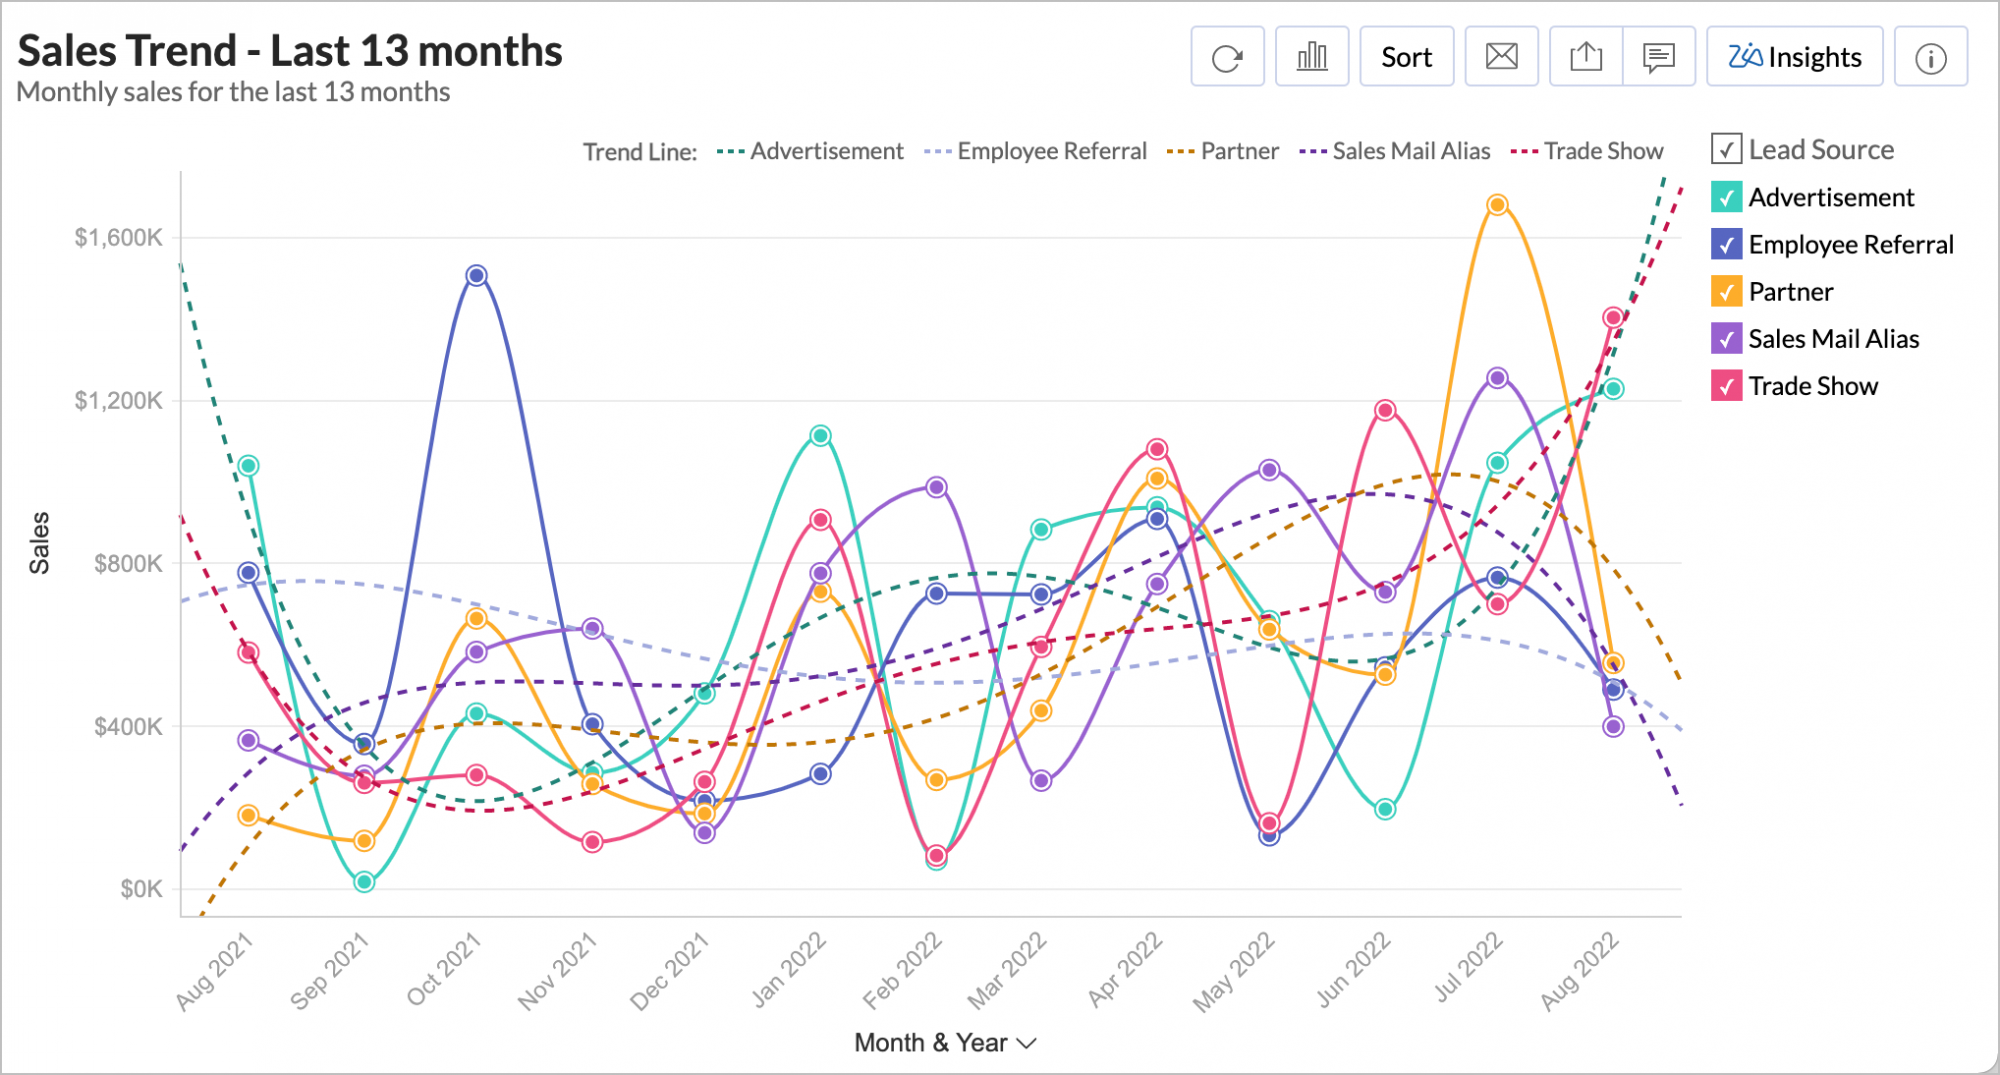
12. Can I set up a Trend Line over a chart with legend?

Yes, you can plot the trend for a chart with legend. 
13. Trend Line option is not available in my chart, why?

The Trend line will be enabled only when it match the following conditions:

  • The chart type should be any one of the following:
    • Line Chart, Bar Chart, Stacked Bar Chart, Scatter Chart, Area Chart, Stacked Area Chart, Bubble Chart (not Bubble Pie and Packed Bubble), Combo Charts.
  • The X-axis of the chart should be a TIME, Date, or NUMBER series.
  • The Chart should have at least one aggregate or measure column in Y-axis.

14. Can my Shared users view the Trend Line? 

Yes, shared users can view the Trend Line. They can also view the Trend Line model applied by clicking the info icon in the Legend Title. Shared Users cannot edit the Trend Line. 

15. Can I Export Trend Line data?

Yes, you can export Trend Line data alone with the chart. 

When exporting into a tabular format (CSV, Excel, Zoho Sheet), Trend Line data will be exported as columns. 

x
Thanks for your interest. We shall get back to you shortly.