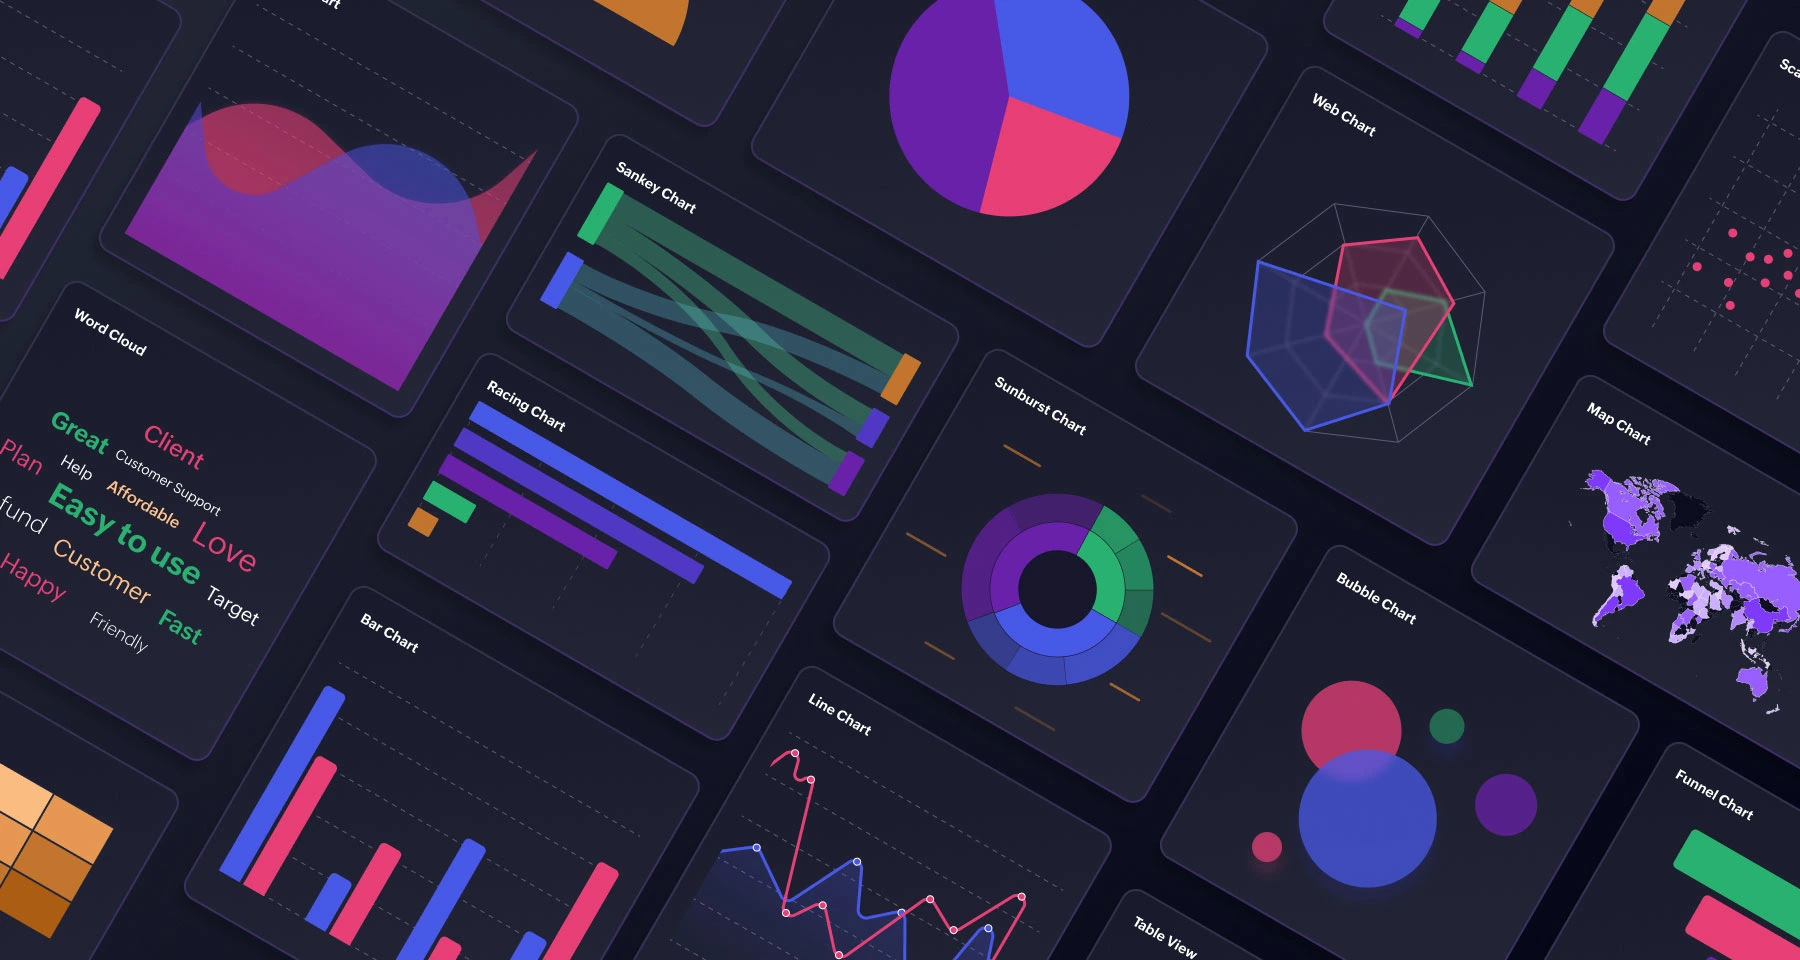
Captivating data visualization
Transform your PostgreSQL data into engaging visual narratives. With Zoho Analytics, you can choose from a wide array of charts, graphs, and maps to best represent your data.
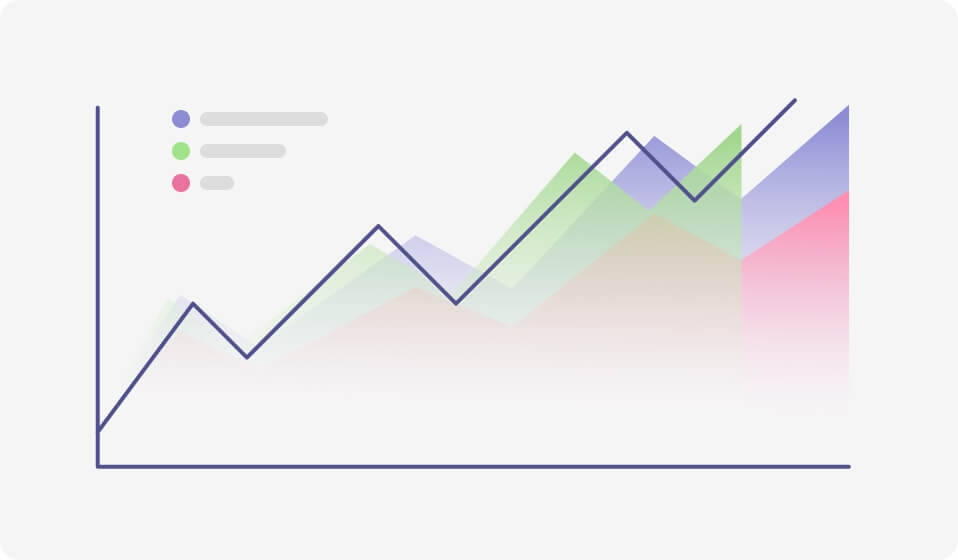
Comprehensive data analysis
Zoho Analytics offers more than just data visualization. Conduct intricate calculations, apply diverse filters, and create calculated fields. Harness the power of predictive analytics and machine learning to anticipate future trends and make informed decisions.
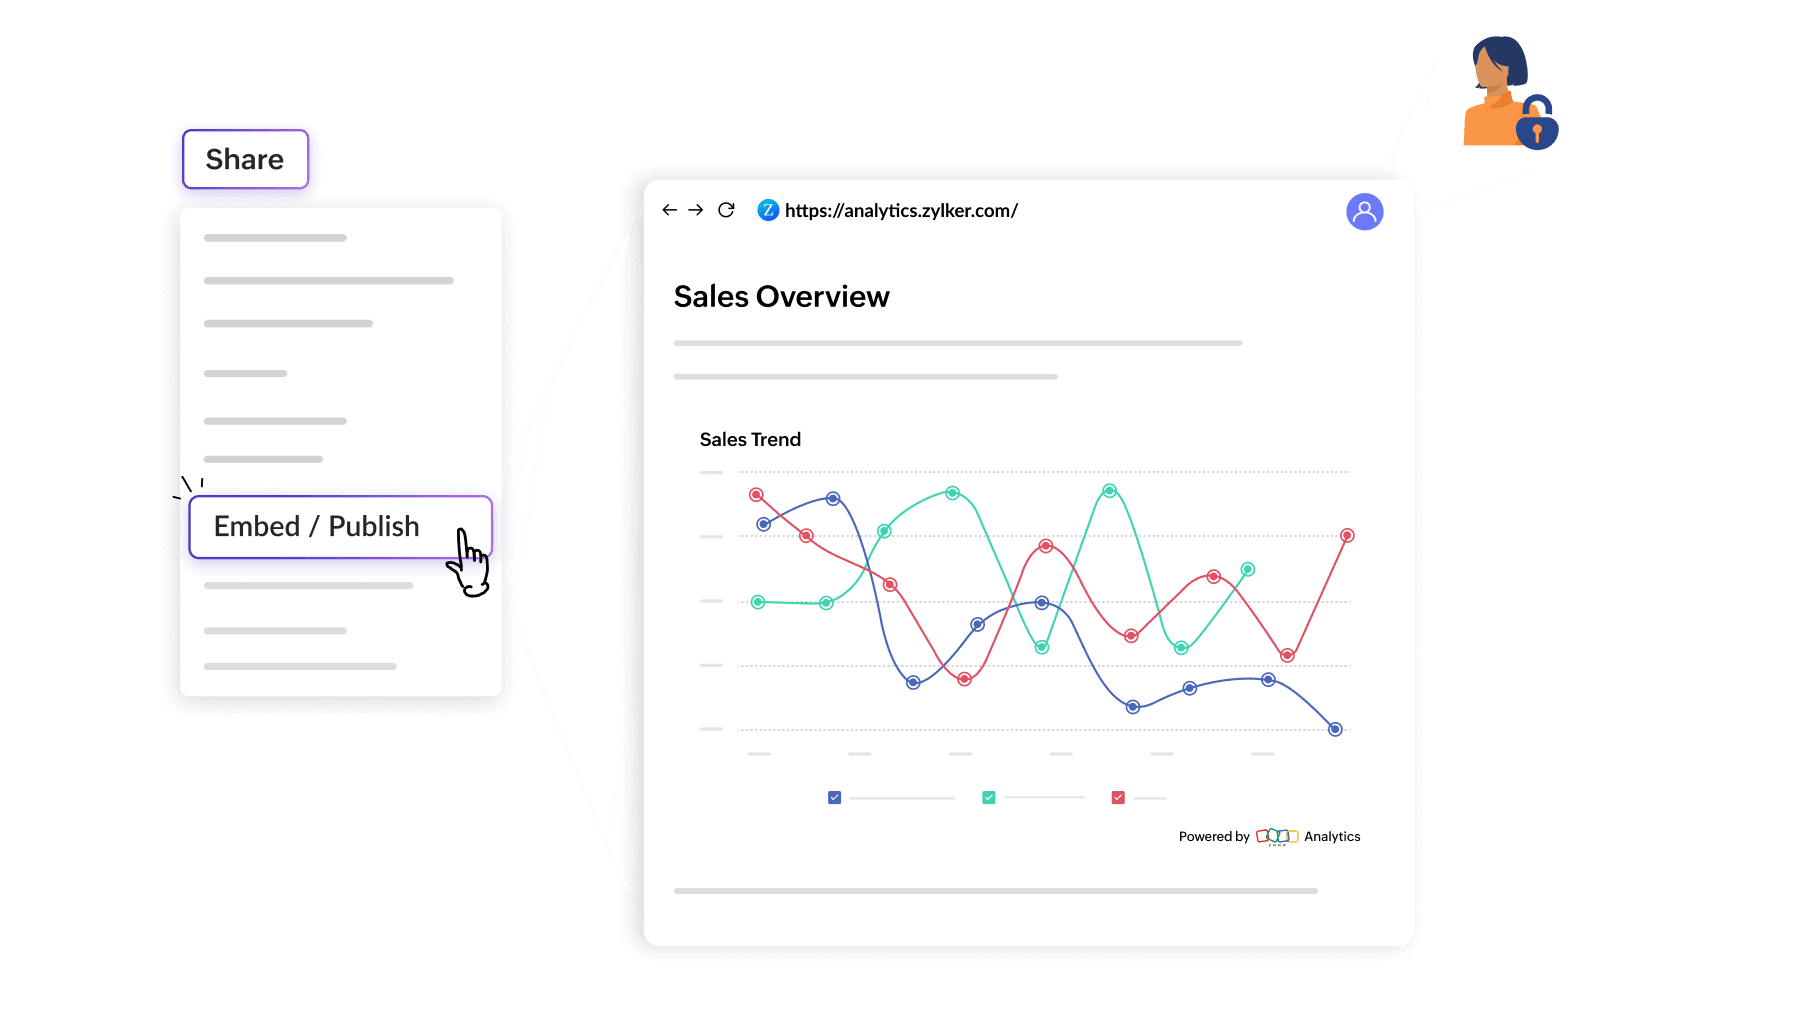
Collaborative data sharing
Share your insights with your team through interactive dashboards and reports. With real-time updates from your PostgreSQL database, your team will always have the most recent data at their fingertips.
Our Customer love us

IT Manager, FANDELI
"The amount of time it takes to generate a report in SAP Business Objects is very long and SAP does not even support collaboration of reports across multiple devices and smartphones. On the other hand, Zoho Analytics is a simple, quick, intuitive tool that allows easy collaboration across devices. Now we can check reports on the go
Rated the best
Unlock the potential of your PostgreSQL data with Zoho Analytics.
Transform your raw data into actionable insights that can drive your business to new heights. Embark on your data analysis journey with Zoho Analytics today, and witness the transformation.