The basics of sales reporting—plus 12 must-have sales analysis reports for sales leaders
- Last Updated : July 18, 2025
- 519 Views
- 12 Min Read
Introduction
Sales leaders need sales reports to manage their teams efficiently and grow predictably. Imagine navigating in a new town without the GPS to guide you to your destination. While you will arrive at your intended destination eventually, it'll take time, effort, and it's simply not the most efficient choice.
Sales reports help leaders rely less on gut instinct and more on data when making critical decisions for everyday situations as well as strategic activities. To create sales reports that inform, deliver impact, and drive action, sales leaders need to have the right set of inputs. We cover a few examples in this blog to get you started on your sales reporting journey.
What are sales reports?
Sales reporting is an umbrella term for a broad range of activities that includes collecting sales data from a CRM tool, making sense of that data using insightful reports, and summarizing the reports to add context and clarity. Having the right sales reports can provide leaders with in-depth insights into their sales teams' performance, deal conversion rate, pipeline health, customers churn rates, marketing effectiveness, win-loss analyses, sales efficiency, and revenue.
The primary objective of sales reports is to help sales leaders:
- Track the efficiency of their sales teams and processes so that they can hit targets more reliably and contribute more to achieving sustainable growth.
- Uncover untapped opportunities hiding in their sales funnels.
- Forecast market demands and shifts accurately.
- Spot underlying problems in the sales process that are dragging down the sales team's efforts.
Why do you need sales reports?
The most obvious benefit of sales reports is the information and insights businesses can use to improve sales efficiency. But if you dig deeper, you can find a variety of ways sales reports can be helpful beyond just efficiency. Here are a few examples:
- Identify recurring trends: It's common knowledge that summer is the peak season for swimwear companies. However, not all businesses have such straightforward relationships with their markets. In such cases, identifying recurring trends helps businesses predict outcomes with greater certainty and stock up on inventory, plan support, optimize supply chains, streamline order prioritization, and minimize operational costs.
- Enhance decisions by leveraging data: Using data for sales decision-making injects objectivity into the quality of decisions. Sales leaders have a natural affinity for their teams and the way they operate. However, relying on data to make critical decisions regarding the most popular product lines, the discounts that generate more sales, and the channels that are most profitable can save them from making costly mistakes and also build team morale.
- Optimize operational strategies: Key insights into personalization, pricing, and advertisement strategies can yield pivotal information that enables sales leaders to identify sales operations that are driving growth and ones that could use some improvement.
- Drive sustainable growth: A business's capacity to sustain growth relies on its ability to detect the earliest signs of changing tides and devise strategies to adapt to those changes. Sales reports can help businesses spot early signs of shifts in customer preferences that stem from market dynamics, pricing expectations, and economic and technological changes, and buy them enough time to react to these changing conditions.
Benefits of sales reports
Businesses that harness the power of data are likely to see three times more benefits, according to a report by PWC. Quantifiable benefits of using sales reports include:
- Informed decision making leading to greater sales: Using sales data and reports in the decision-making process injects confidence into decisions and minimizes any fallout. As a result, sales leaders can approach selling armed with better answers and close more deals confidently.
- Improved team and rep performance: Even without sales reports, it's easy to see the reps who close the most deals. Sales reports can point out the reps who bring the most difficult deals to closure and those who need additional training to improve their output.
- Better team morale and motivation: Moving from instinct-driven to data-driven evaluations of accountability has proven to bring clarity to teams. With data to back up each sales rep's achievements, it becomes easier to target bigger, complex deals. This also fosters healthy competition, enabling reps to draw inspiration from each other's performance records.
How to write an effective sales report
Deriving deep insights from your data starts with understanding your objectives. Here's a proven approach to building effective sales reports that offer insights, drive action, and deliver favorable outcomes:
- Write for your audience: Regional heads might be more interested in learning about the performance of their respective regions, while global heads might want an overarching view of sales. Know your audience and their needs to make sales reports relevant.
- Write to achieve your objective: When reporting on YoY revenue, don't include team contribution to revenue—that's a topic for a separate report. Focusing on too many data points in one report can be distracting and pull your audience away from your objective. Likewise, stick to a time frame. Reports for daily, weekly, monthly, and yearly performance should be separate.
- Select the right metrics or KPIs: Choose metrics and KPIs that convey your objective. For example, metrics such as sales pipeline, sales growth, and pipeline health together convey how your pipelines are holding up to your monthly or quarterly targets.
- Select the right reports: The right chart type can convey your point without a single word being said. With a plethora of chart types available, choose the ones that are most suited to represent your metrics.
- Highlight trends and seasonal changes: Notice a sudden decrease in average deal value? Or an increase in cart abandonment rates? Highlight those trends in the report with bold text and get your audience to pay attention to changes and trends.
10 important sales reports for sales leaders
Sales reports help guide leaders to make the right decisions, objectively assess current approaches, converge and align people towards overarching objectives, and improve efficiency. Let's explore the reports now:
1. Sales pipeline
The sales pipeline report helps you understand the health and status of your pipeline. With a visual map of deals in various buckets (or pipeline stages), you can track the number of overall deals and the number of deals in each bucket, the average deal size, and the length of the average sales cycle.
A healthy sales pipeline should have an equal distribution of deals across all buckets. This gives your sales team a steady flow of leads to work on as each deal inches closer towards deal closure.
A pipeline view of sales also helps you identify the stages where deals stagnate—indicating possible problems such as bottlenecks, poor engagement, mismatches between products or strategies and customers, and stages where deals fall off, all of which opens the way for further investigation. On the brighter side, the pipeline view also shows whether your conversion rates are healthy and why, creating room for discussion on sales activities that are working well in moving deals along the pipeline.
Here's a sample sales pipeline for Zylker Automotive across these sales stages: inquiry, test drive, negotiation, financial approval, and deal closure.

When to use this report: Use this report to understand pipeline health, as well as to determine which of these two options will drive more sales: pumping more leads into your pipeline or fixing gaps in your pipeline process.
2. Total sales
It's wise to keep an eye on monthly sales figures to track your progress towards your yearly sales targets. It would be great if your businesses saw a consistently upward trend of total sales month-over-month, but more realistically, businesses go through ups and downs in sales thanks to seasonal trends in customers' purchase preferences.
By itself, total sales is a cumulative figure and offers only a broad view of your sales growth. If you're in the sales cockpit, leading your team's sales efforts, it's important to slice and dice this figure to understand how various teams, industries, territories, products, sellers, sales tactics, and seasons are performing.
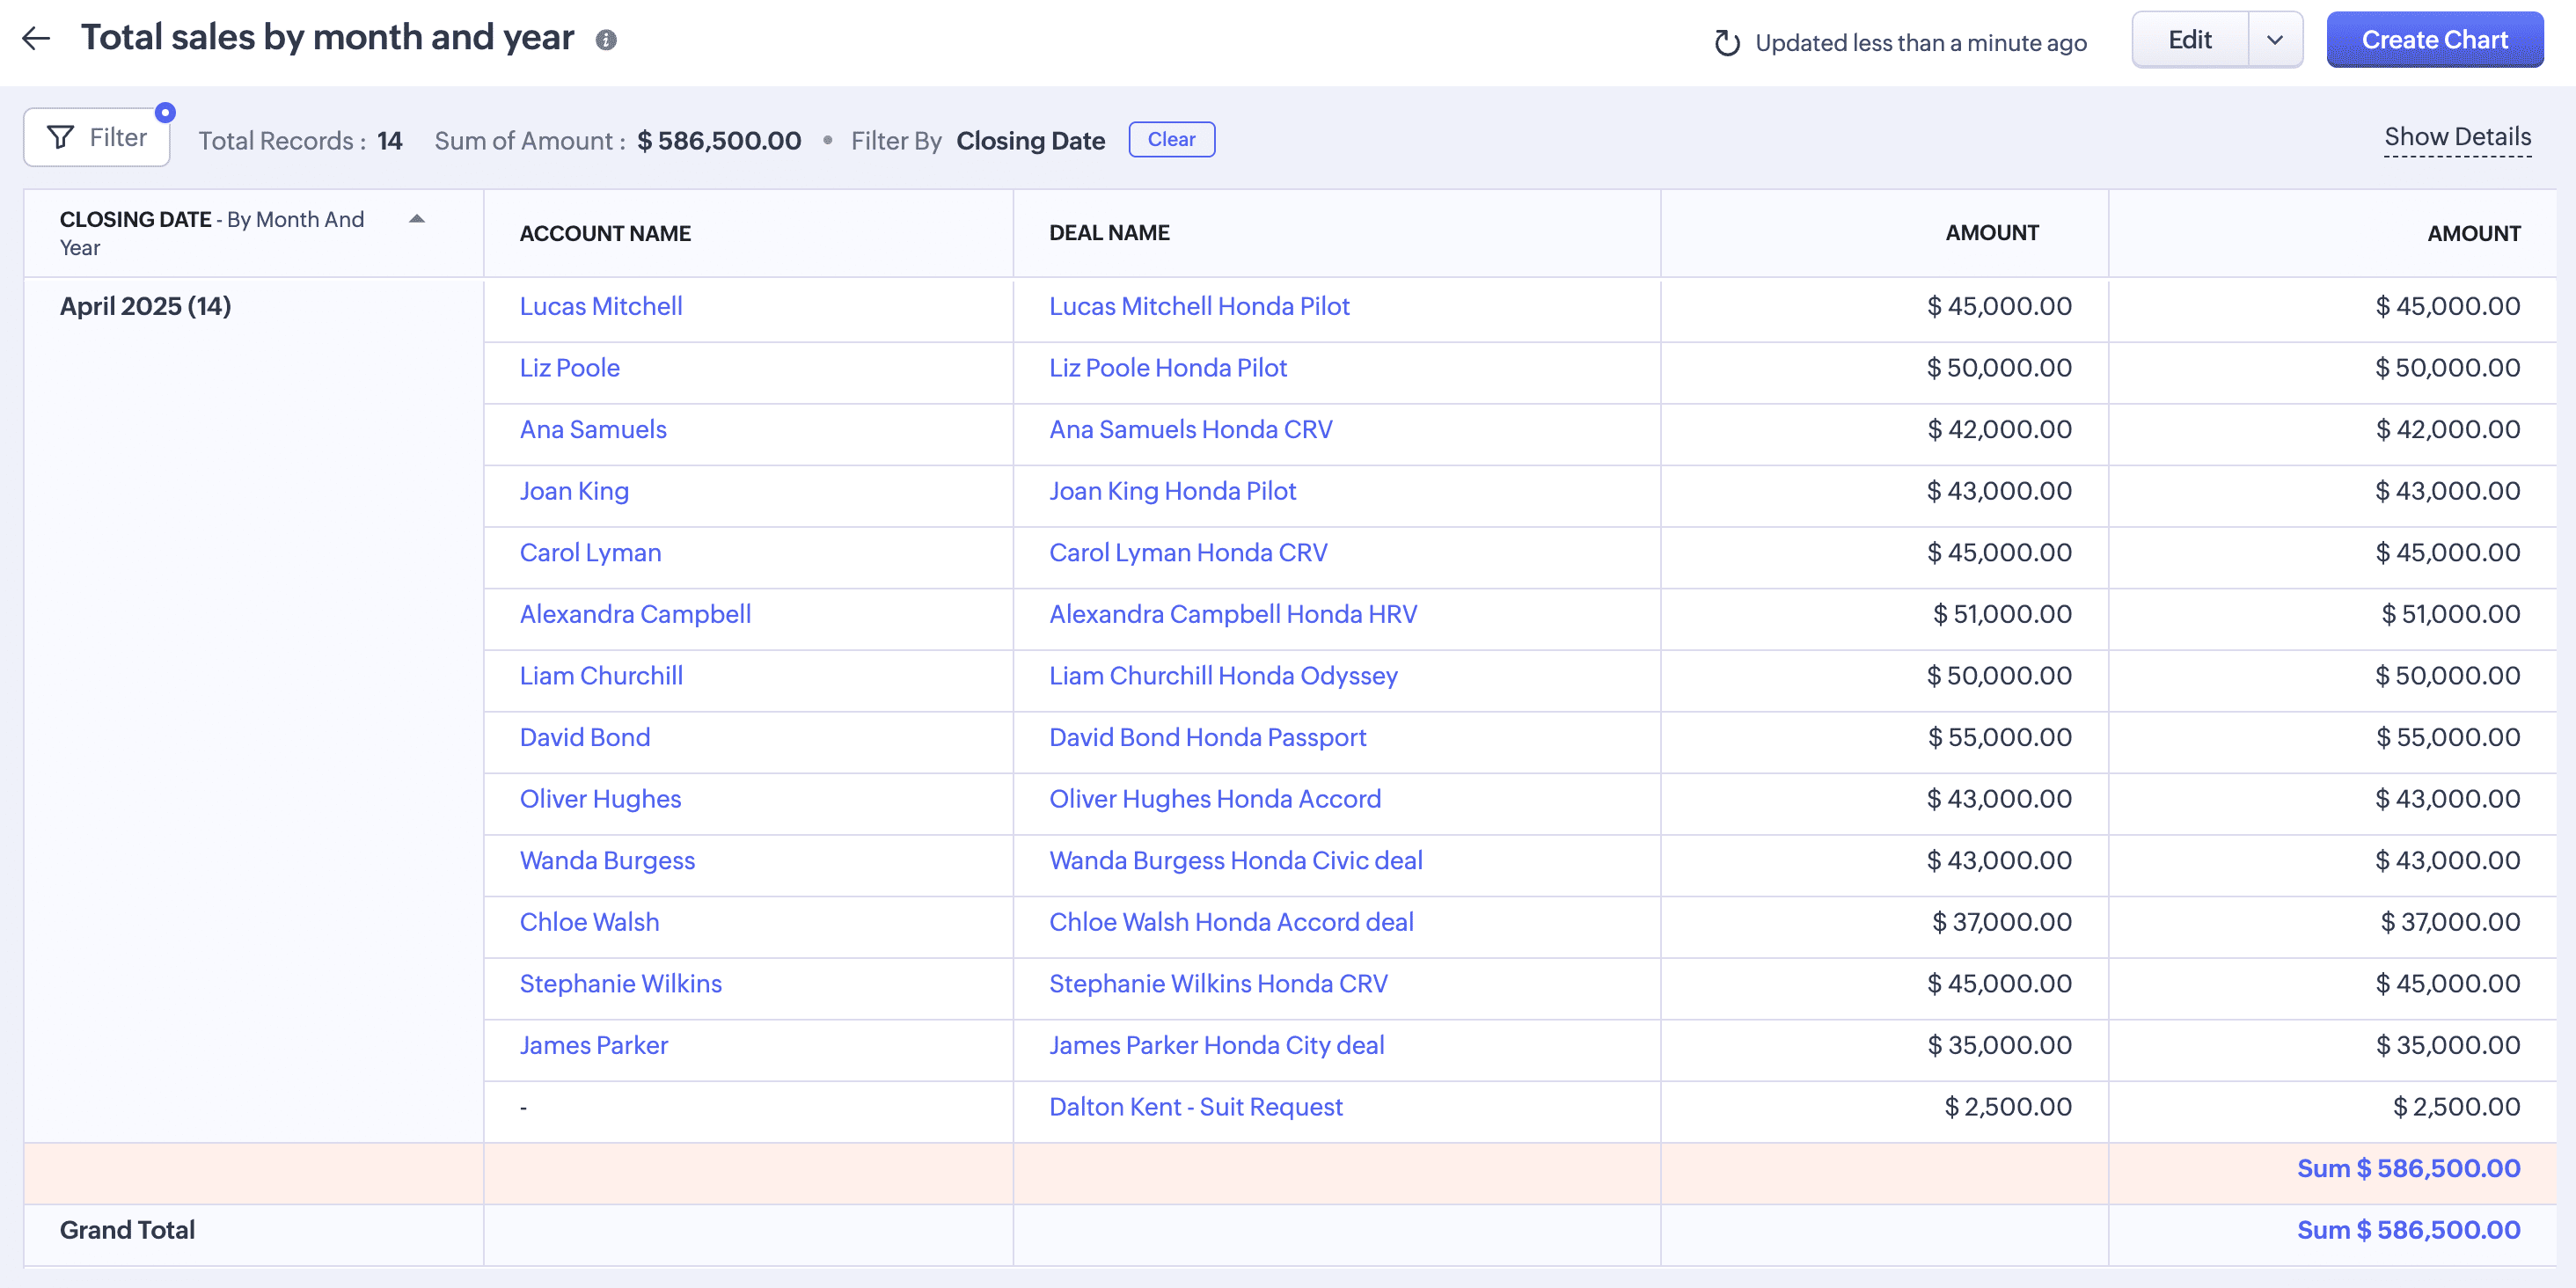
When to use this report: Use it to gain a high-level overview of your sales figures each month.
3. Average deal size
Average deal size is a measure of the average value of deals or orders in a particular period. This value is highly dependent on the number of closed-won opportunities and the discounts offered, so it's important to maintain a standard scale to measure the average deal size.
When working towards achieving a bigger target—say, $2M in sales this quarter—it helps to know the number of deals you'd need to hit this target. The higher the average deal size, the greater the growth. You can increase your average deal size value with targeted, account-based upselling and cross-selling, value-based pricing, and varied product bundles.
For businesses that cater to multiple segments—such as small, medium, mid-market, or enterprises—using a single average deal size report may not be prudent. Calculating the average deal size for different buckets based on segments provides a clearer picture.
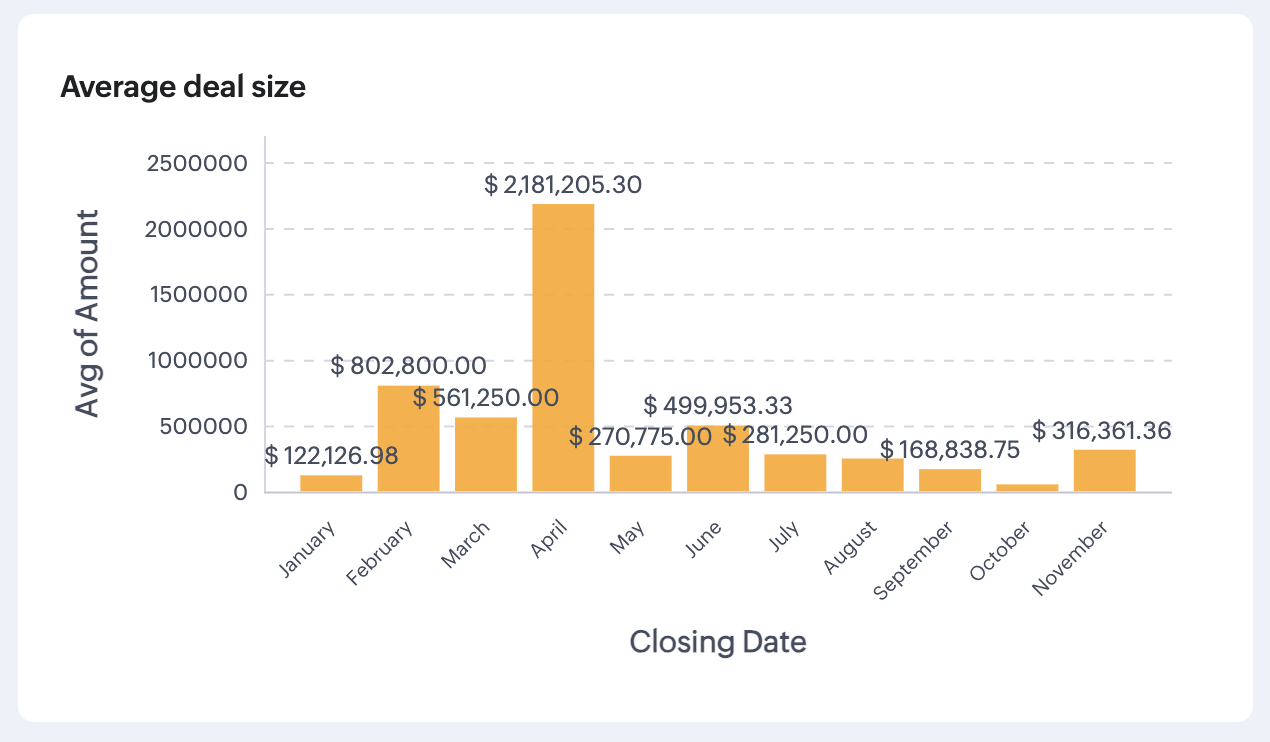
When to use this report: Use it to gain a high-level overview of the average deal sizes for various segments, as well as to analyze and forecast business revenue. It can also be reverse-engineered to calculate how many deals are needed to hit specific revenue goals in each segment.
4. Average sales cycle
A sales cycle is a measure of the time it takes for leads to convert into buying customers. Typically, leads go through the various stages in a sales cycle, such as prospecting (leads), engagement, qualification, demo, objection handling, negotiations, and deal closure. A measure of your average sales cycle is simply a measure of the average time it takes to close deals, taking into consideration all your deals and the total time it takes to close them.
Knowing your average sales cycle length is critical to revenue planning, as it helps sales leaders plan revenue targets for each month. It's also a litmus test for a variety of problems that may be hidden in your sales operations, ranging from a poor product-market fit and under-performance among the sales team to poor lead targeting and misaligned strategy changes.
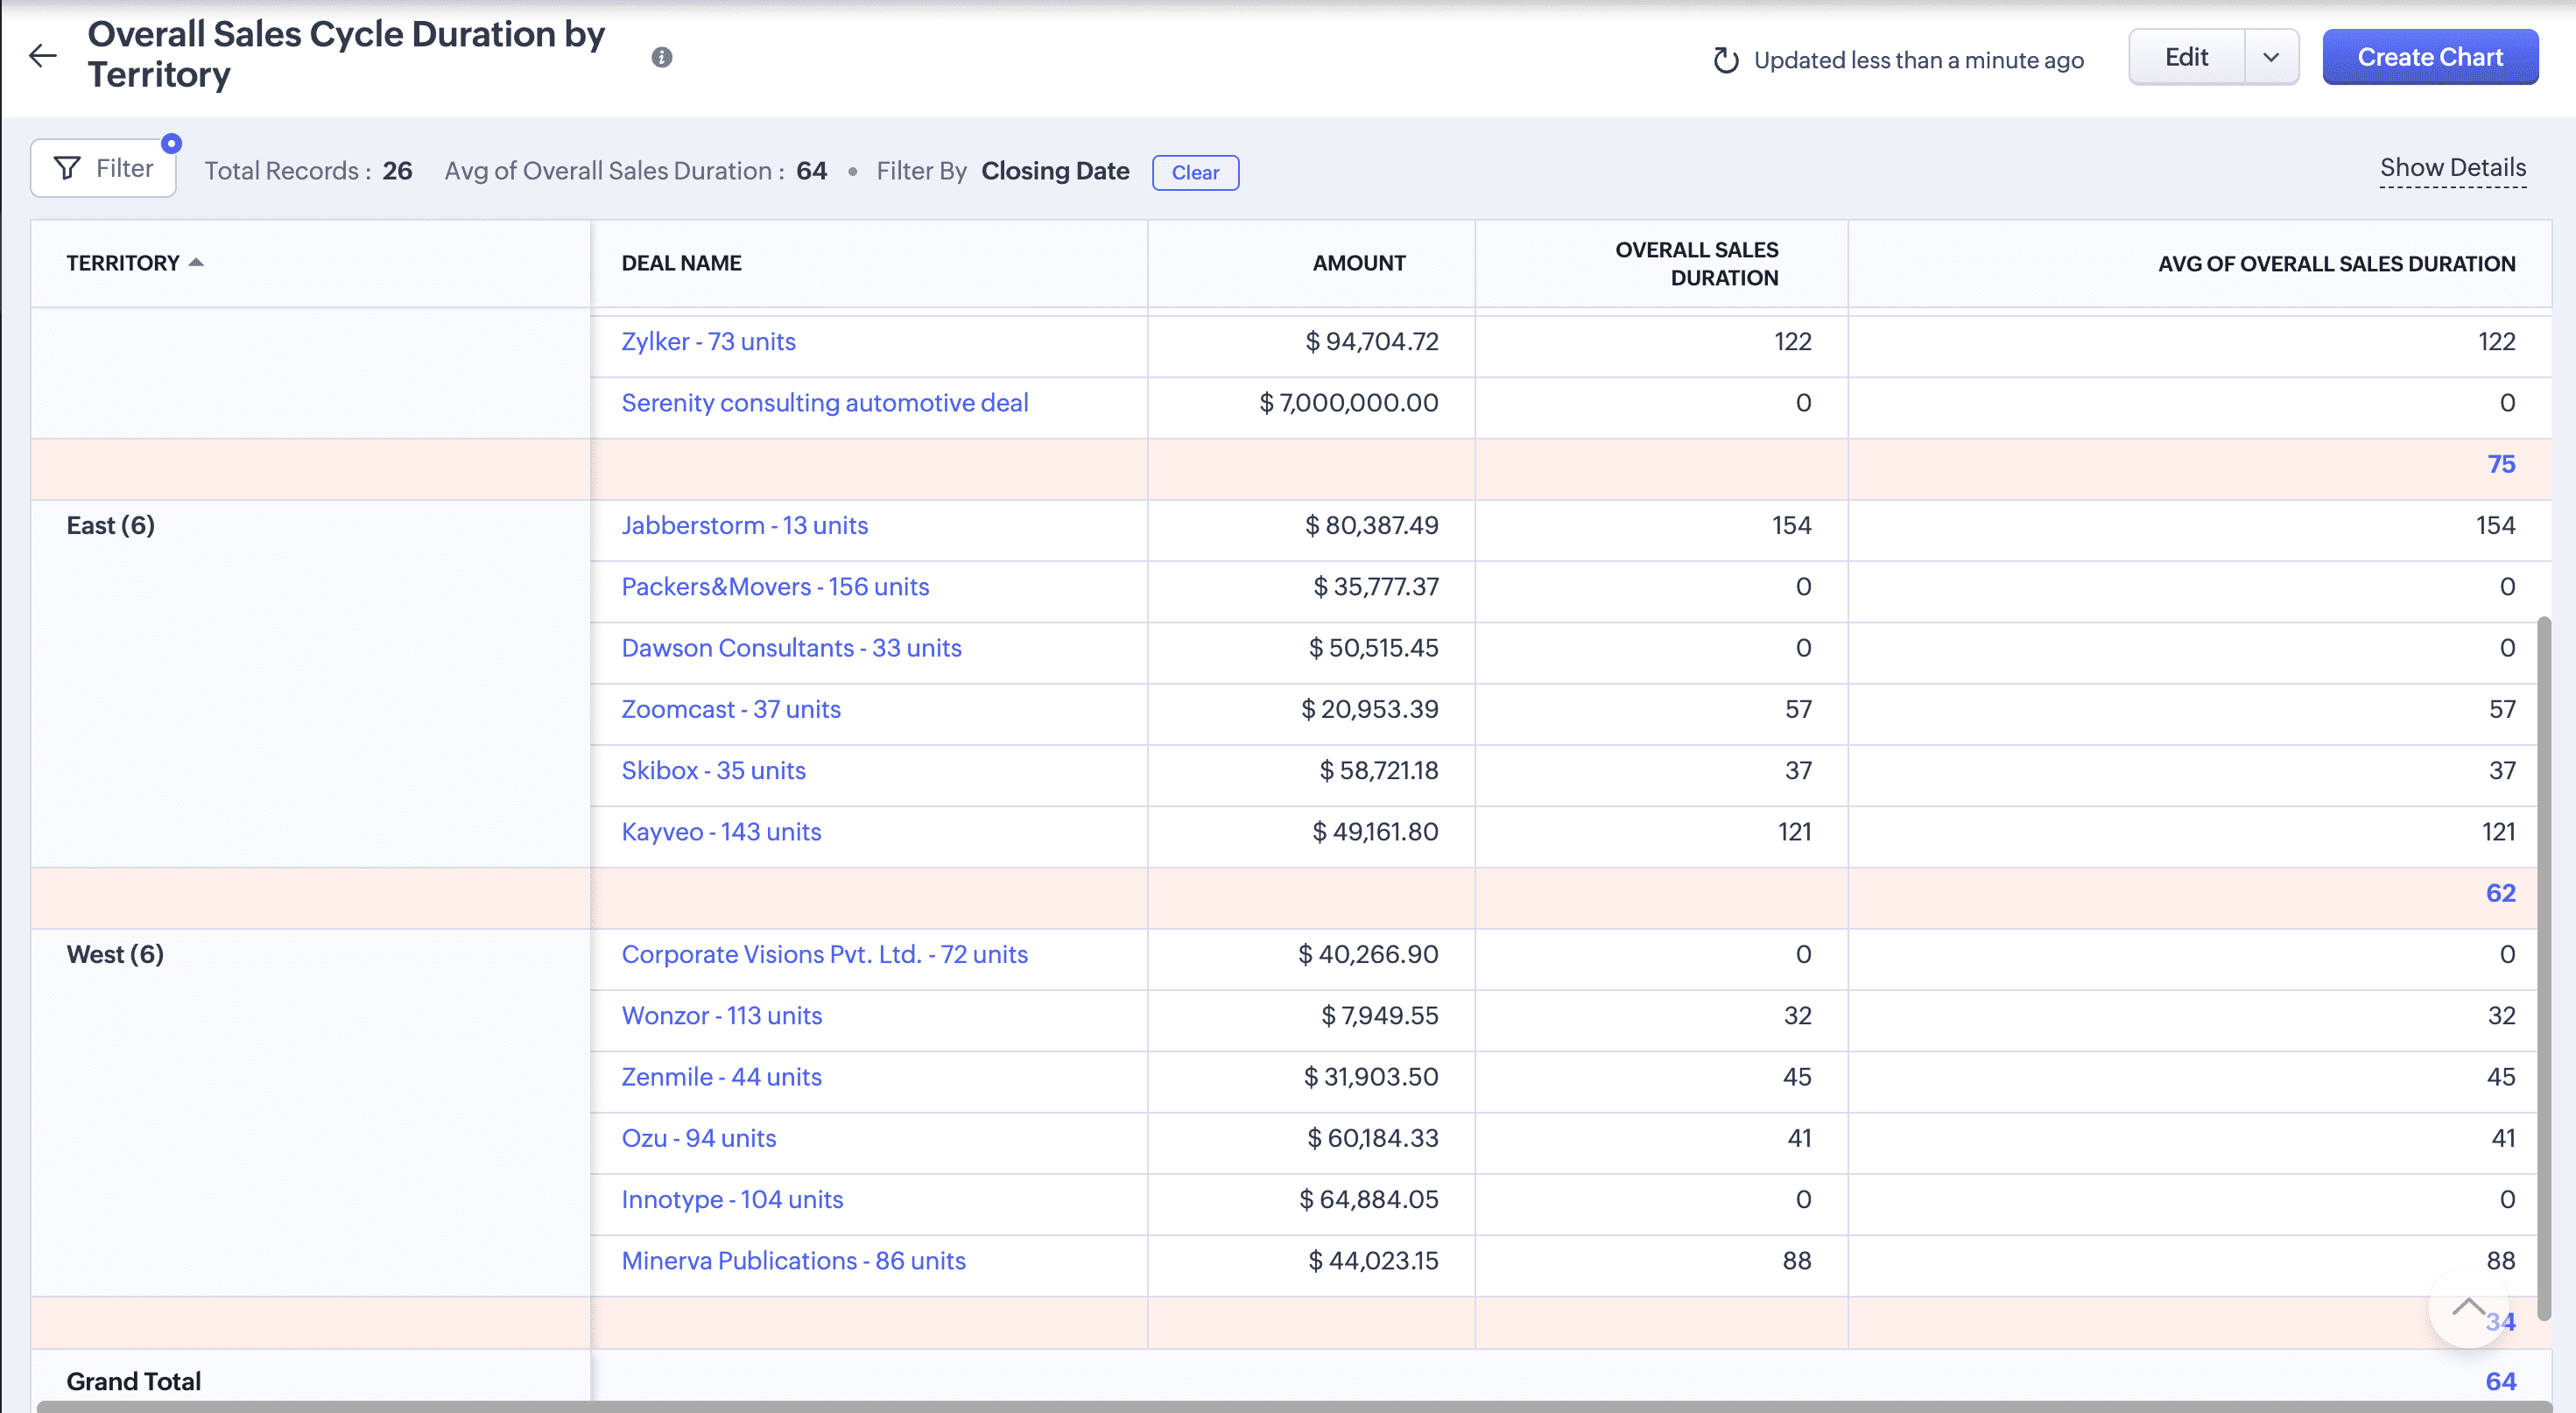
When to use this report: Use it when you want to understand if there are underlying problems in your sales process at a glance, and when you're looking to forecast revenue based on the current deals in the pipeline.
5. Win-loss analysis
So you have a great product that solves an actual market need, and you're blessed with a fantastic sales team—yet you lose a good portion of your deals. Why? A win-loss analysis is a detailed study of why some deals are won while others are lost—something that's generally determined by interviewing leads who have decided to drop your brand.
Remember that for every ten customers who leave your brand, only three might care to speak up. So it's important to note the reasons for their dissatisfaction carefully and act on them.
Aside from exit interviews, your sales pipeline data can offer a plethora of information on why and at what stages leads drop your brand. Given below is a summary of a win-loss analysis performed for an insurance company, which outlines the reasons leads have dropped off.
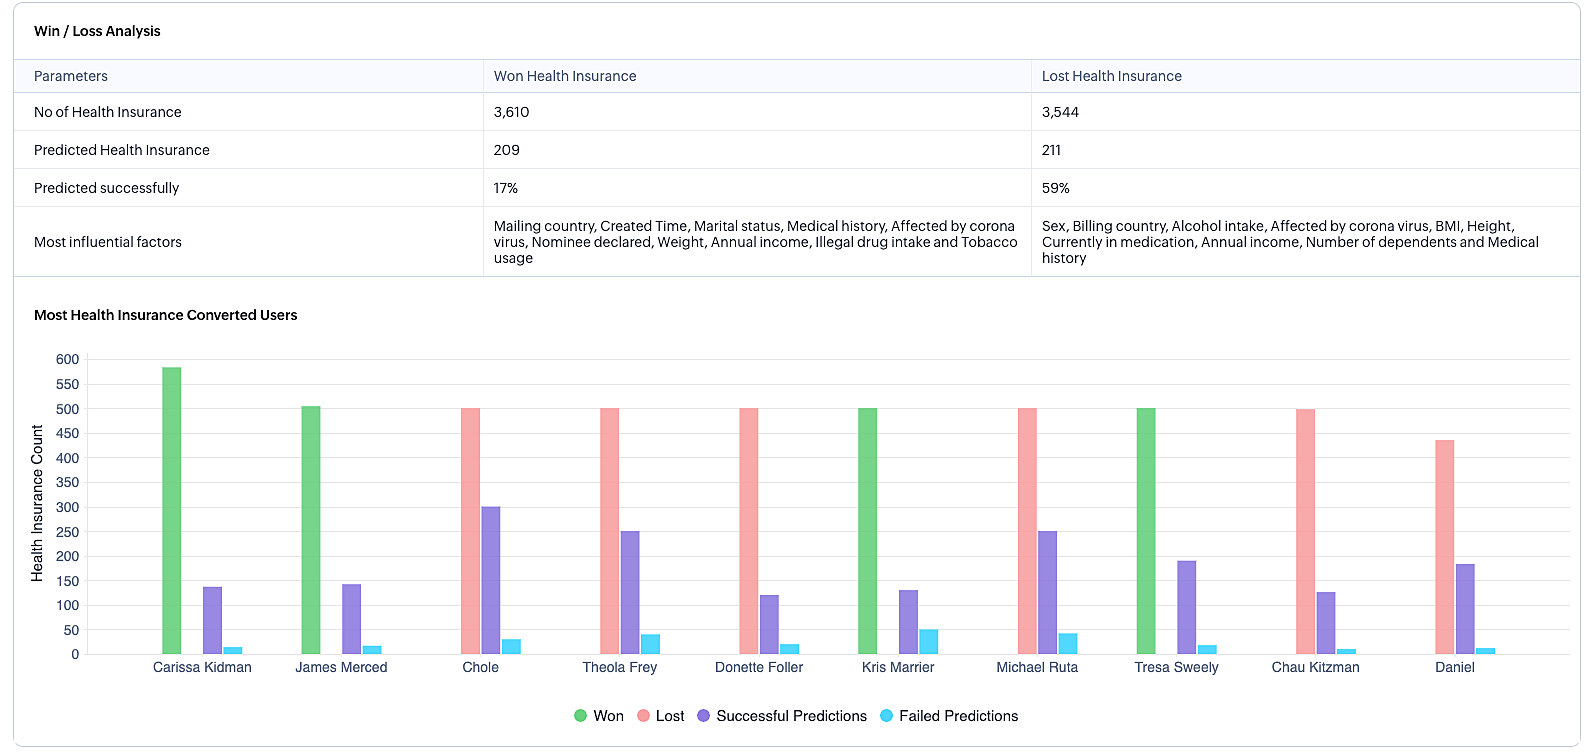
When to use this report: Use it to identify the leading factors that drive deals to closure and those that hinder it.
6. Customer retention cohort
Cohorts help trace behavioral patterns and identify common traits among customers of various segments throughout the customer life cycle. The report below details the product usage stats among new users and shows that 50% of customers drop off within 14 days after product signup.
Assuming that half of signed-up users will drop off, sales leaders can fine-tune their onboarding flows to minimize these dropoffs through improved customer engagement, consistent nurturing efforts, and journey-driven sales tactics.
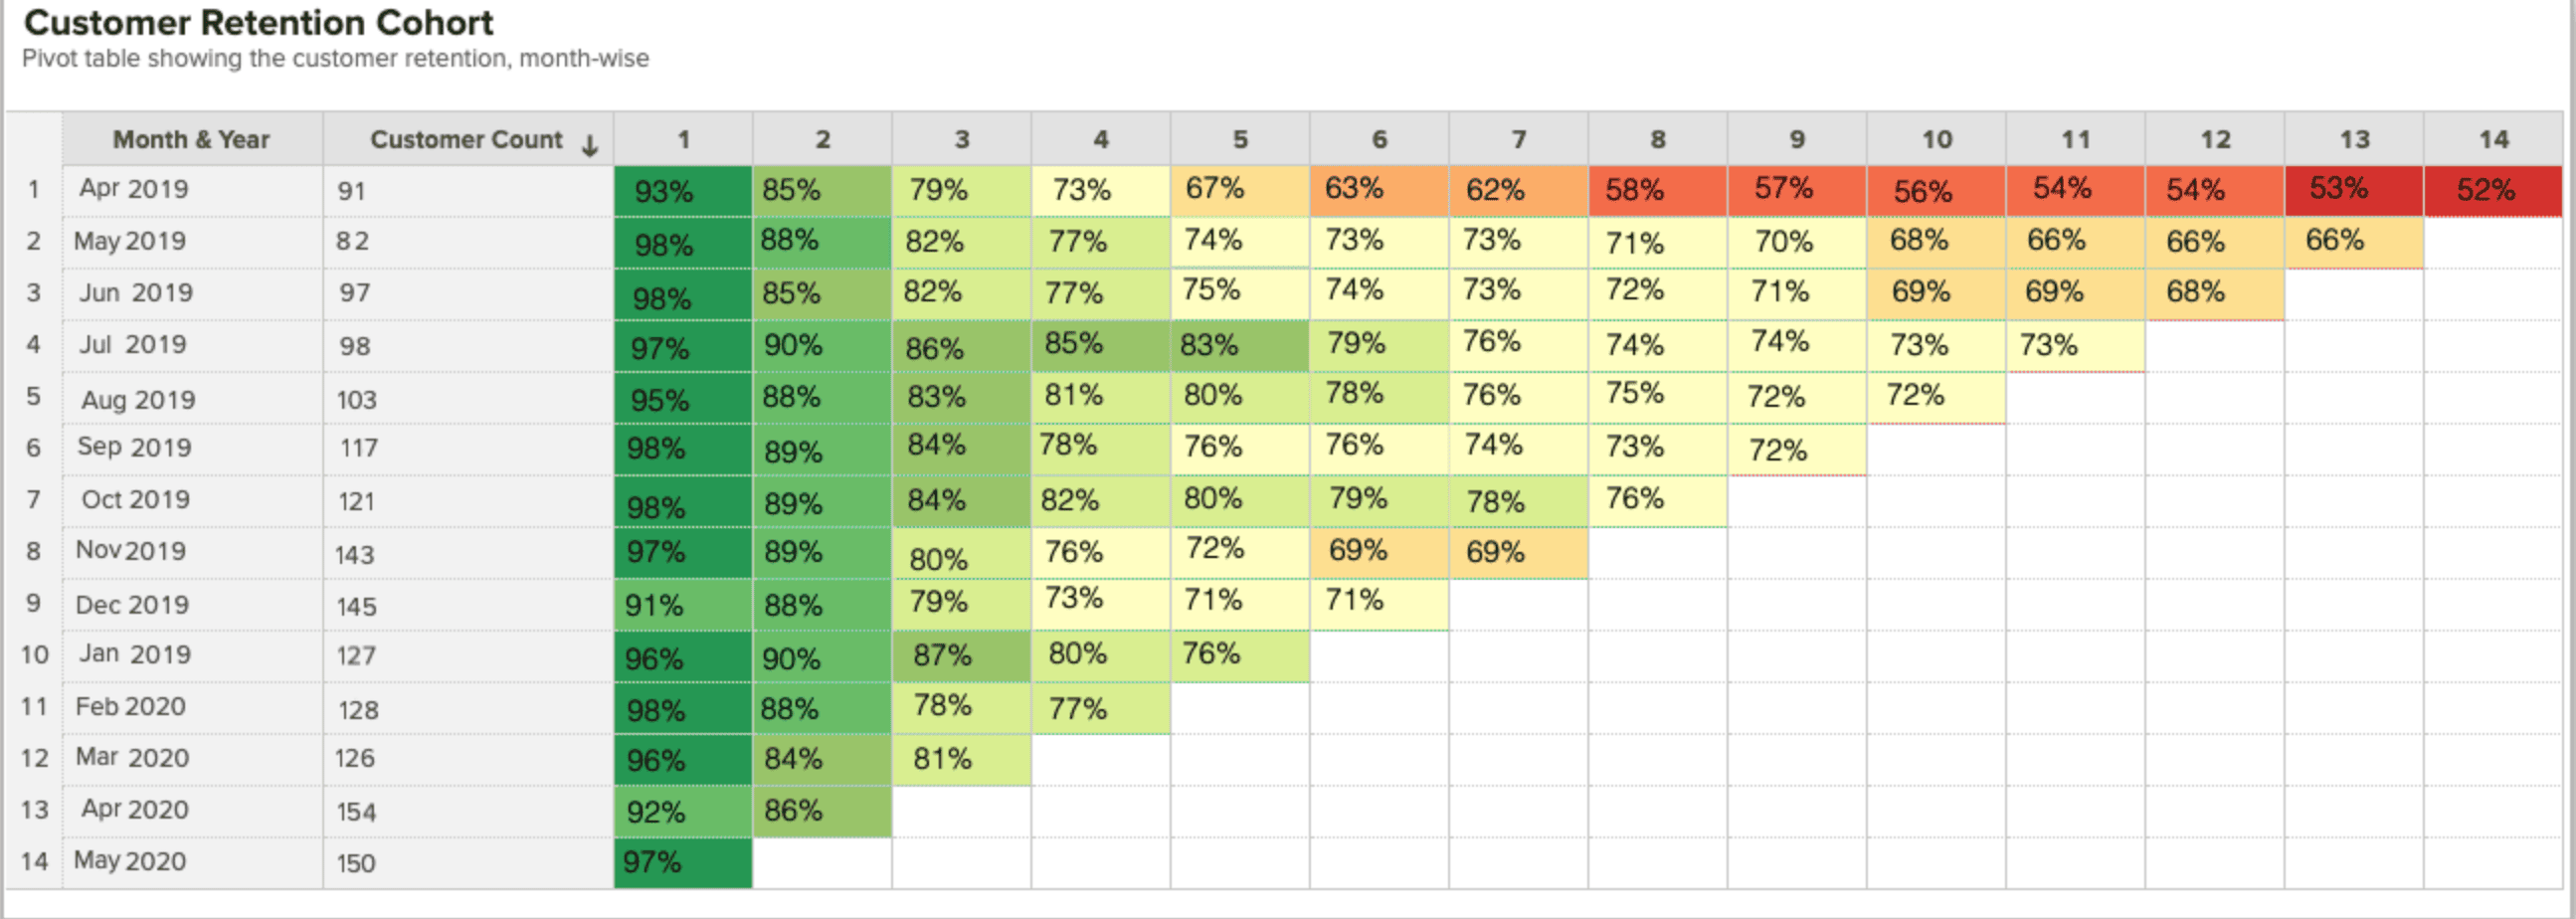
When to use this report: Use it to track behavioral patterns among customer groups as they go through the customer lifecycle. Cohorts are useful to improve user onboarding experiences and to reduce customer churn.
7. Sales calls
Sales calls are phone calls or meetings that each member of your sales team completes within a given period. While the metric itself is pretty straightforward, it's important because sales calls naturally add a personalized touch to buyer outreach that boosts the number of deals closed. So ideally, the number of deals closed should increase in parallel with an increase in the number of calls made in a given period.
When you observe that your sales team is making as many calls as they can but still aren't closing, it's an indicator that you need to fine-tune their soft skills and selling skills.

When to use this report: Use it to monitor the number of calls each sales rep makes, to set daily benchmarks for calls to be made, and to measure the impact of calls on deal closure rates.
8. Lead response time
Lead response time refers to the time it takes for sales reps to respond to or get in touch with a new lead. Typically, it should be as low as possible—the lower, the better. The first hour after a lead signs up is the golden hour, after which the possibility of getting in touch with the leads decreases by tenfold.
The impact lead response time has on your sales process depends on your industry, sales team size, the nature of your business, and the products you sell. Not every business can afford a 24/7/365 sales team that's ready to reach out to leads instantly after signup. But it's possible for businesses to get closer to the ideal figure through effective workload management, use of AI bots and optimization tools, and through automation.
When to use this report: Use it to monitor the average time it takes for sales reps to reach out to new leads and to compare their lead response times against industry benchmarks.
9. Total revenue
Similar to total sales, total revenue summarizes your business's sales and revenue for a given period. While sales determine the total amount of income obtained through the sales of goods or services, revenue encompasses the entire amount you receive through not just sales and services, but also licensing fees or investment income.
Revenue is a complicated metric, and different businesses often use different yardsticks to track, measure, and calculate revenue. However, it's important to understand that sales is a subset of revenue, while revenue is a broader term that includes stock, equipment, and property.
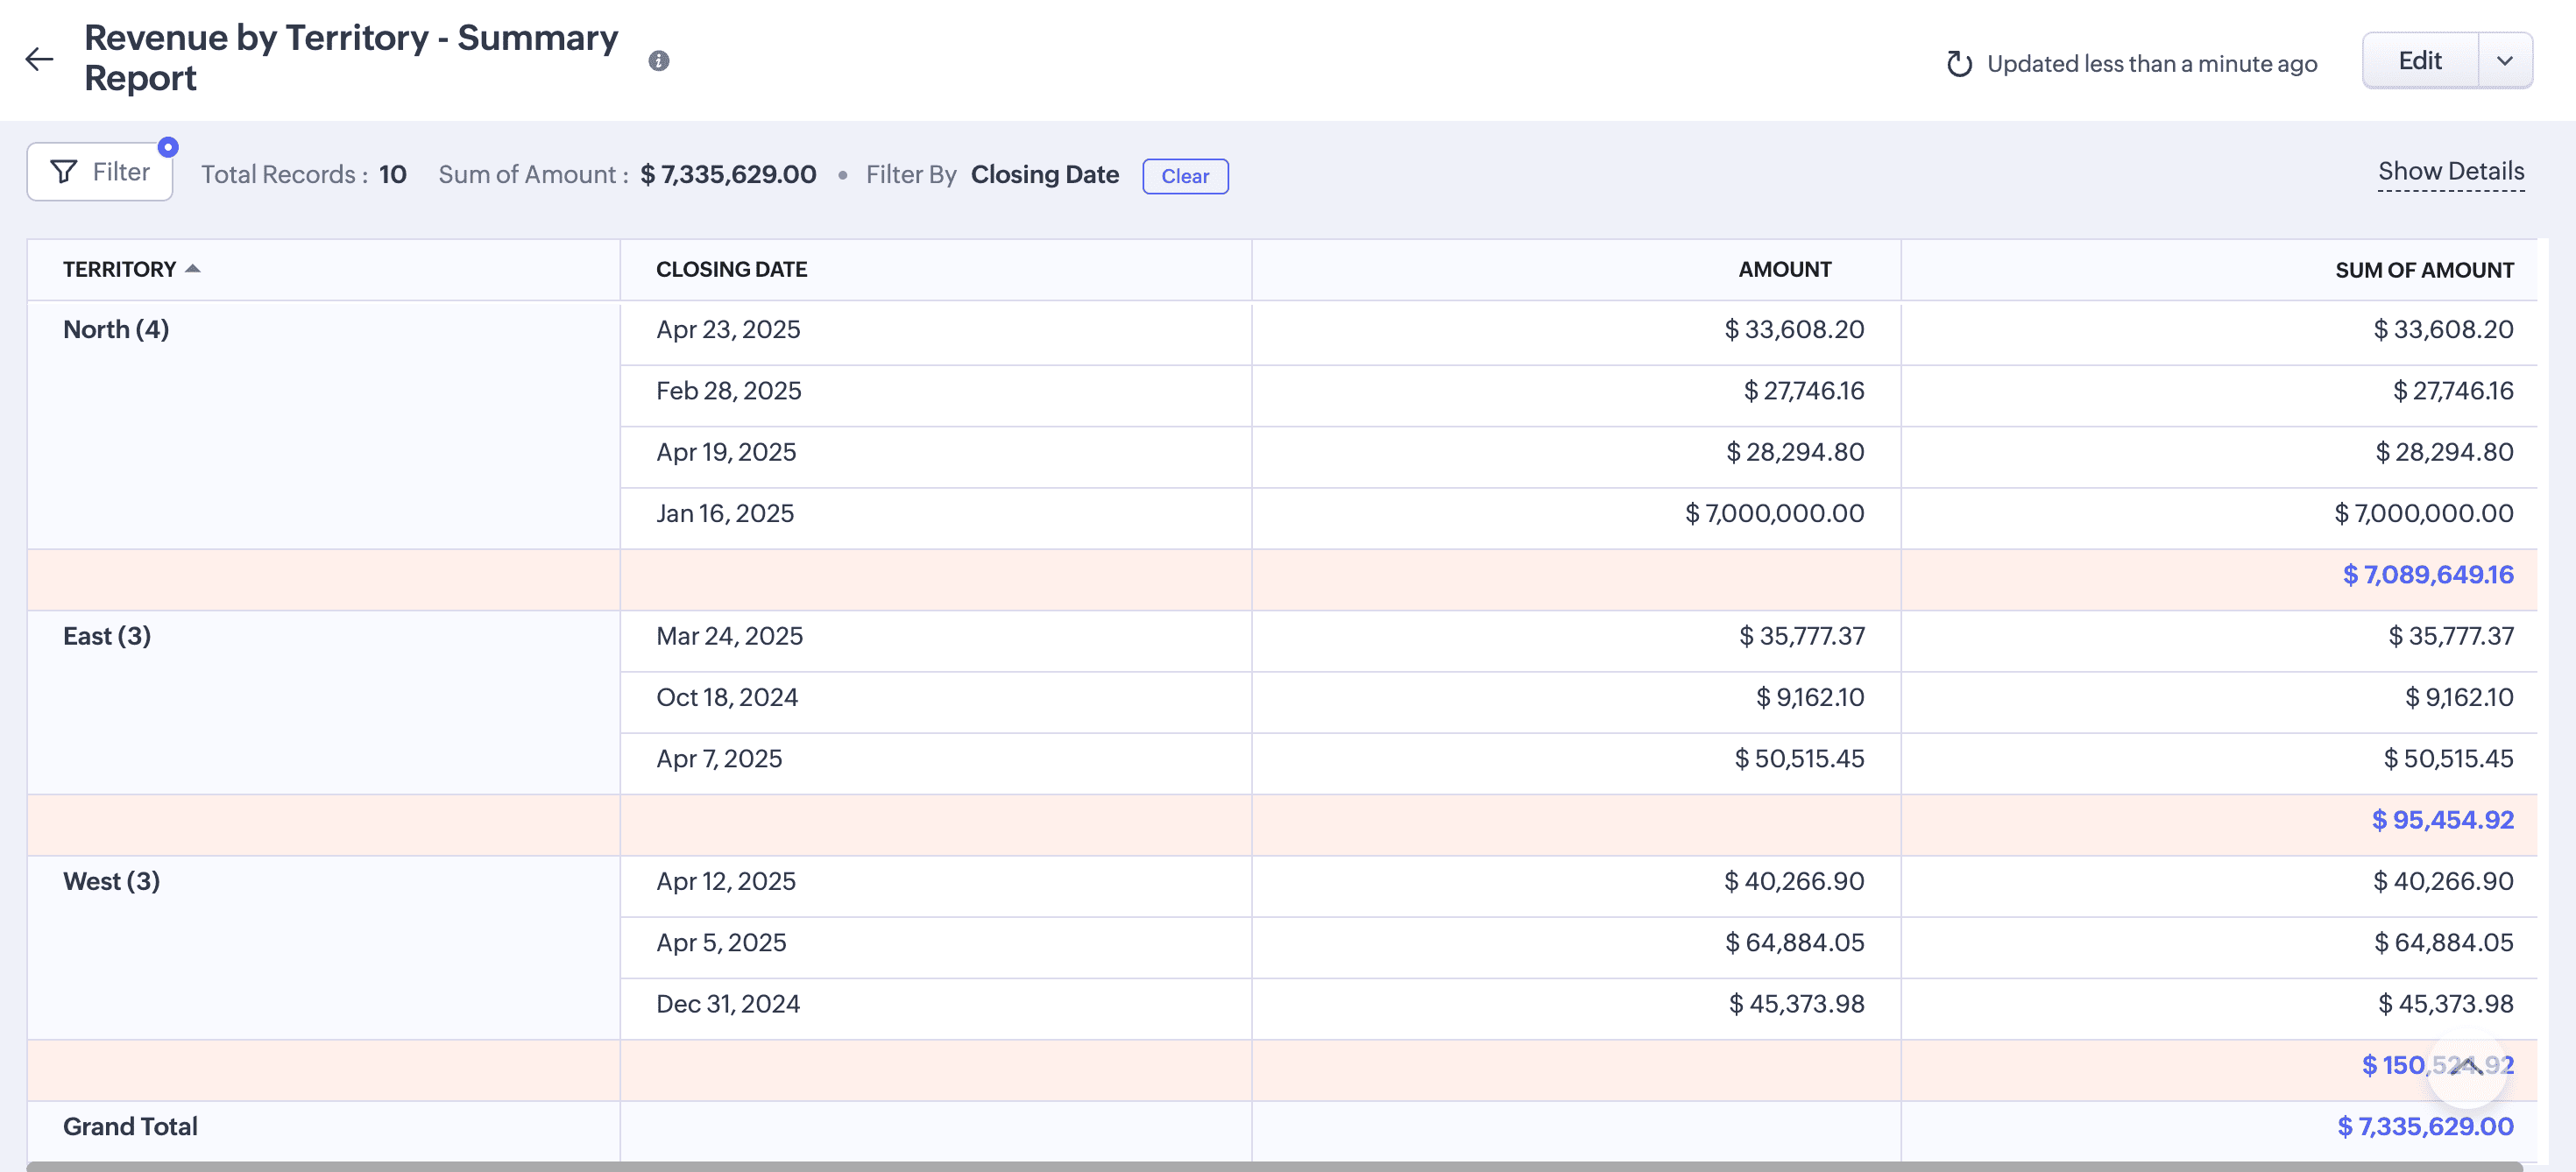
When to use this report: Use it to get a basic understanding of your revenue from various regions, territories, products, or industries. For a deep-dive into revenue analytics, it's best to build a revenue dashboard with reports that suggest how you can increase revenue.
10. Forecasted vs. actual sales
Sales forecasts are educated estimates of future sales, determined by accounting for market trends, customer demand, and sales teams' performance. "Actual sales" refers to the total sales your business has in fact generated after adjusting for discounts or returns. These two values are often the same, but sometimes they aren't. These discrepancies could be due to changes in market demand, faulty forecasts, or poor planning.
Comparing forecasted and actual sales helps identify discrepancies, pinpoint reasons for those discrepancies, and identify any gaps in the sales process. It also helps you evaluate the accuracy of your forecasts and make better sales forecasts in the future.
Comparing forecasted and actual sales also helps identify stop-gap measures you can take immediately to ensure you hit your targets, such as pumping in additional resources, funneling in more leads through additional campaigns, or offering discounts to boost sales volume.
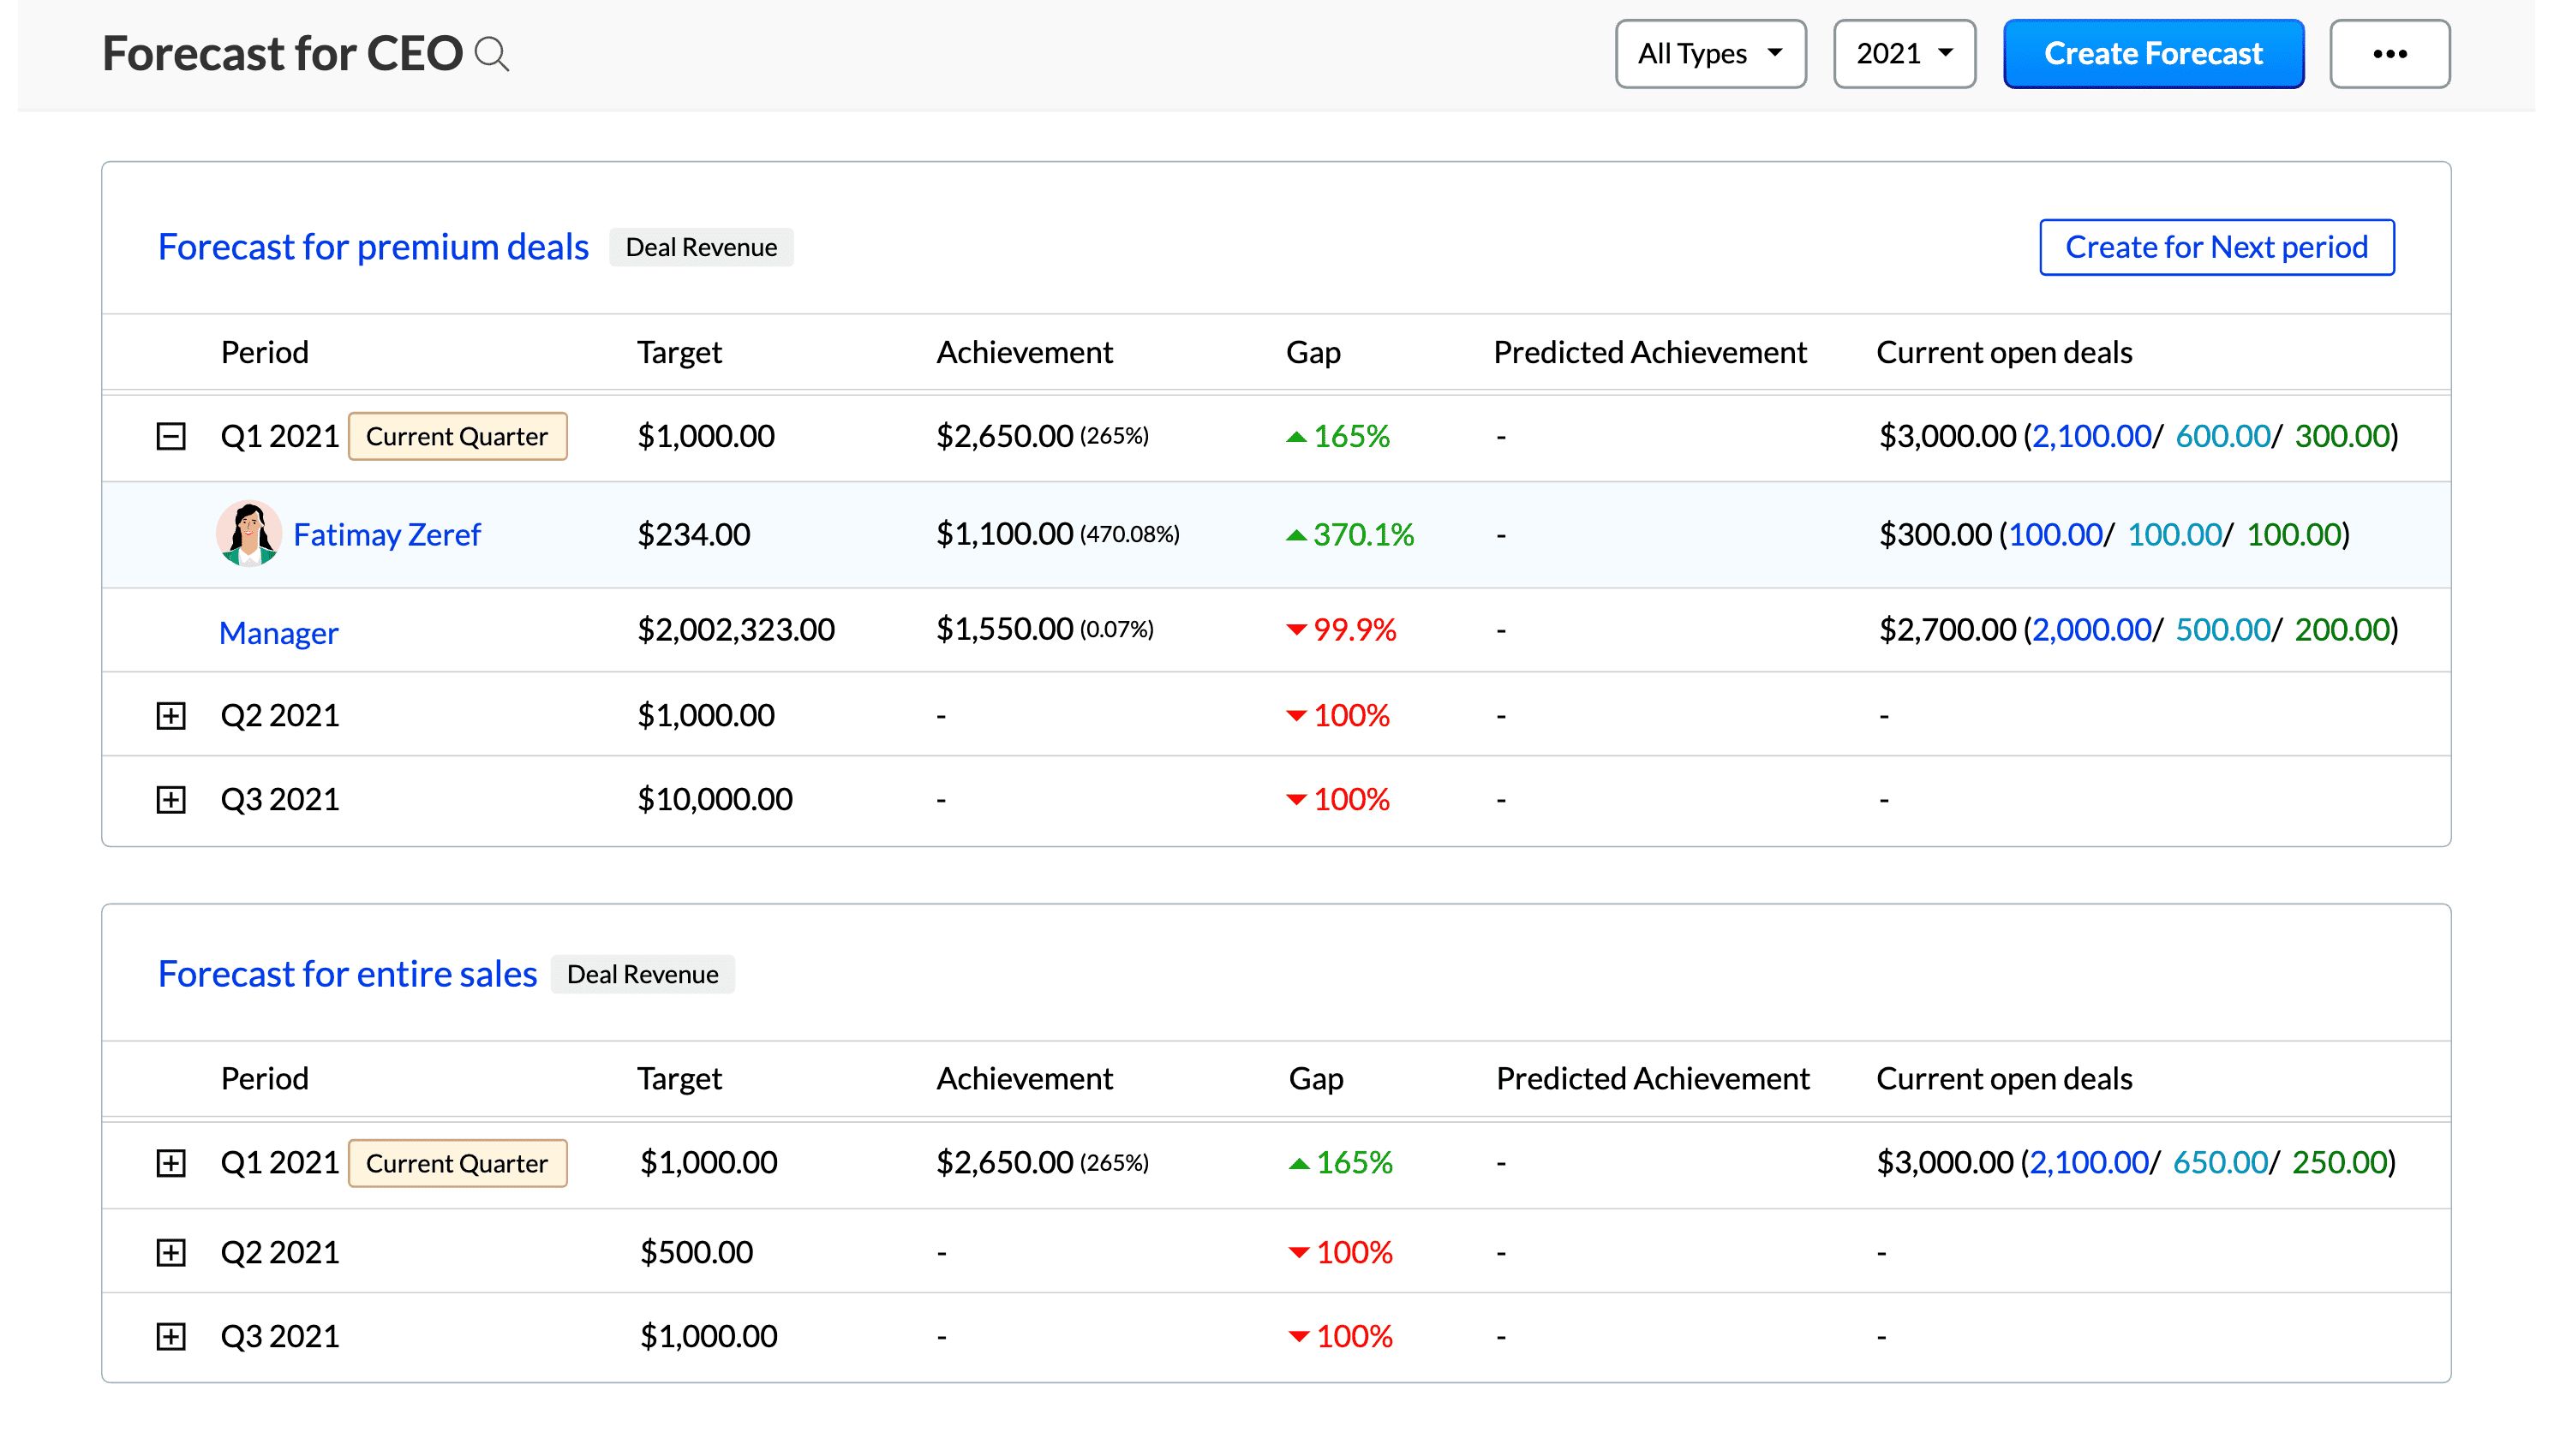
When to use this report: Use it to measure the accuracy of sales forecasts and get actionable insights into optimizing them.
11. Reasons for lost customers
It's no secret that obtaining new customers takes twice as much time and effort as retaining existing customers. From a brand perspective, this also means that you've lost customers due to reasons that were completely within your control and not governed by external factors.
Pull this report every quarter to get fodder for fruitful discussion among the leadership team on the changes you can implement to minimize the number of lost customers and increase retention rates.
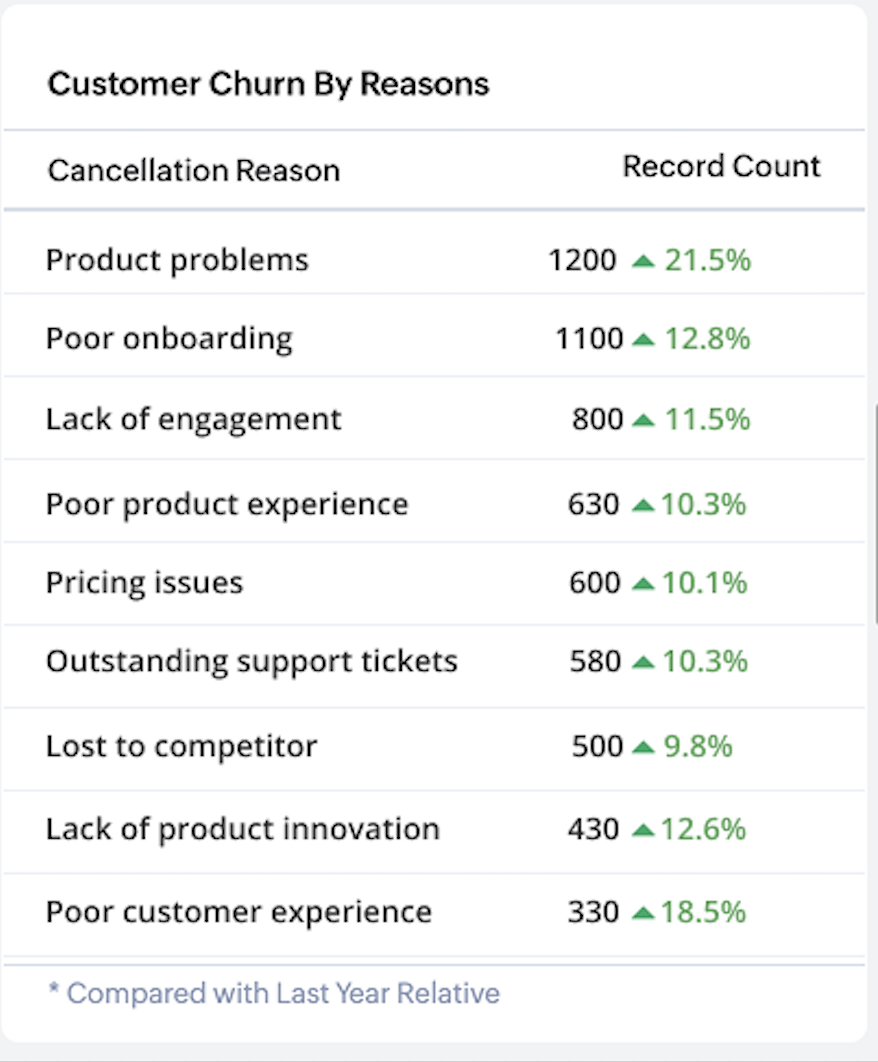
When to use this report: Use it to identify reasons why customers drop your brand, assign weight to those reasons, and bring about organizational-level changes to improve retention.
12. Conversion rate
The percentage of leads who convert into committed customers represents your conversion rate. Essentially, it's a measure of the effectiveness of your sales process in handling and engaging with leads. Typically, you should aim for a higher conversion rate, which would mean that a large portion of your leads that sign up go on to become customers. A high conversion rate in combination with a short sales cycle is what sales reps and leaders dream of.
Businesses can improve conversion rates by narrowing down to the right audience groups, building customer segments based on customer interest, and building brand authority—all of which make buying decisions easier for customers.
When to use this report: Use it to analyze if and how your sales processes are effective. Monitor the conversion rate report alongside the sales funnel stage report to identify where customers drop off and how it impacts your overall conversion rate.
As a sales leader, you need to keep track of every action that transpires in your sales process. This is often hard to do given the size of your team and the scale of your business. Building reports that deliver actionable insights into key sales operations and performance is the best way to keep track of your team and your business. The reports discussed in this blog are good examples that can help both new and experienced sales leaders keep tabs on their operations.


