Event series
2019
Dec
Dec 02, 2019 | |
Mark Reports as Filters in Dashboard
Zoho Analytics now allows you to set Reports to act as filters in your Dashboard. With this, you can dynamically filter the entire dashboard by clicking on any data point of a report. This further enables enhanced user interactions with the Dashboard. Click here to learn more about Reports as Filters. Activity Logging
|


Dec 30, 2019 | |
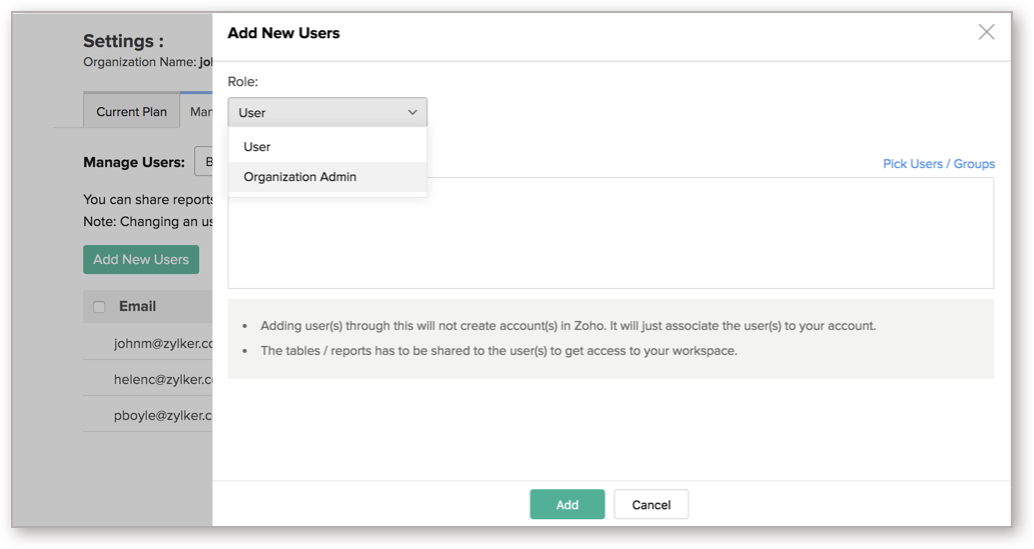
New Role - Organization Administrators
Zoho Analytics now supports a new role - Organization Administrators. Organization Administrators are users who have access to all the workspaces in the Organization, and can perform all the operations inside the Organization, except deleting and renaming an Organization; and adding, activating, and deactivating other Organization Administrators. Organization Administrators are nearly as powerful as the Account Administrator (Owner of the account). You can have multiple Organization Administrators in your Zoho Analytics account. Click here to learn how to add an Organization Administrator to an account. |
Oct
Oct 16, 2019 | |
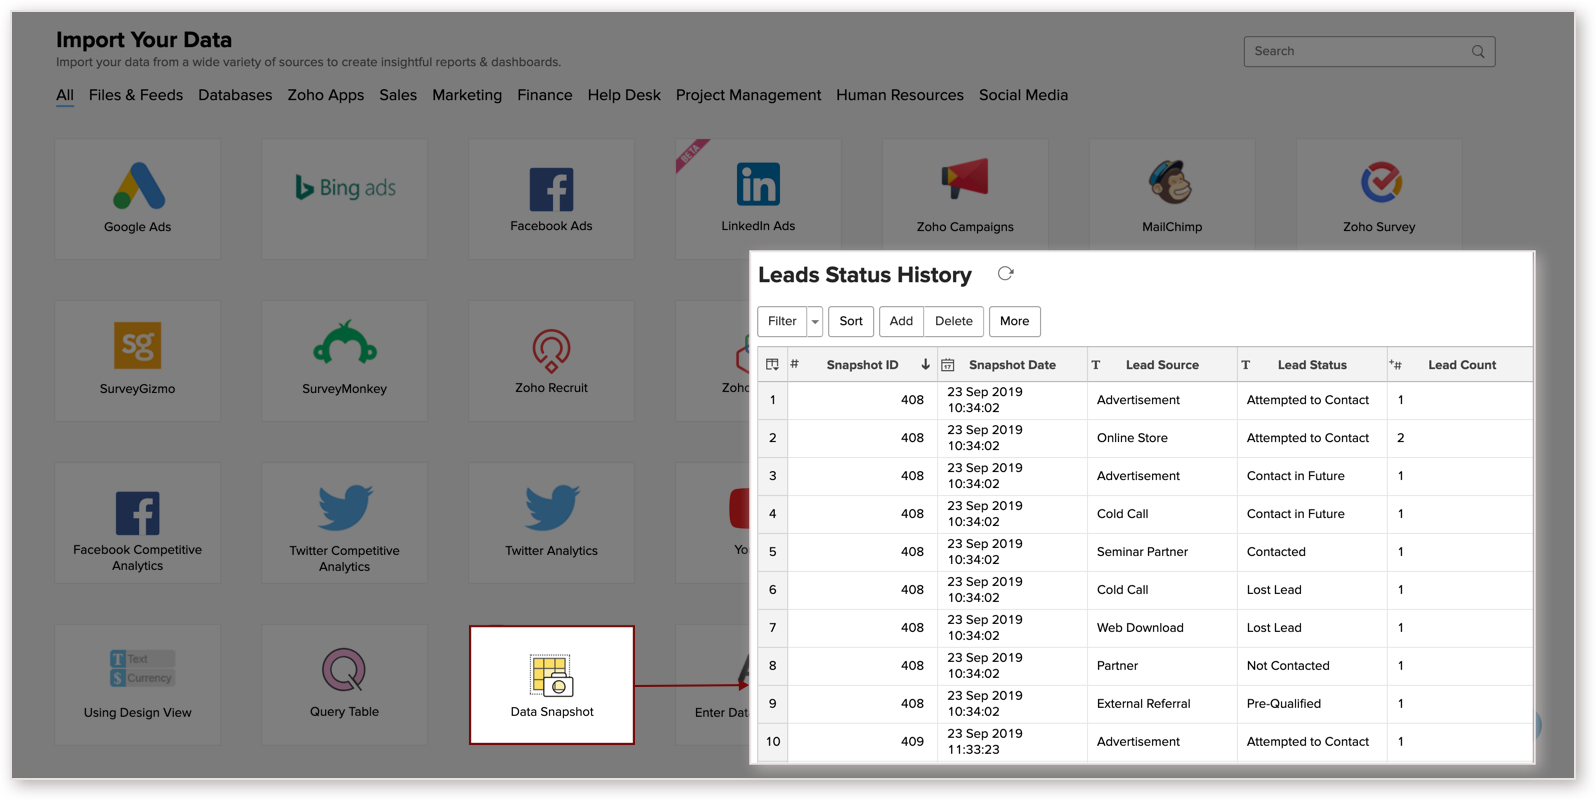
Introducing Data Snapshot
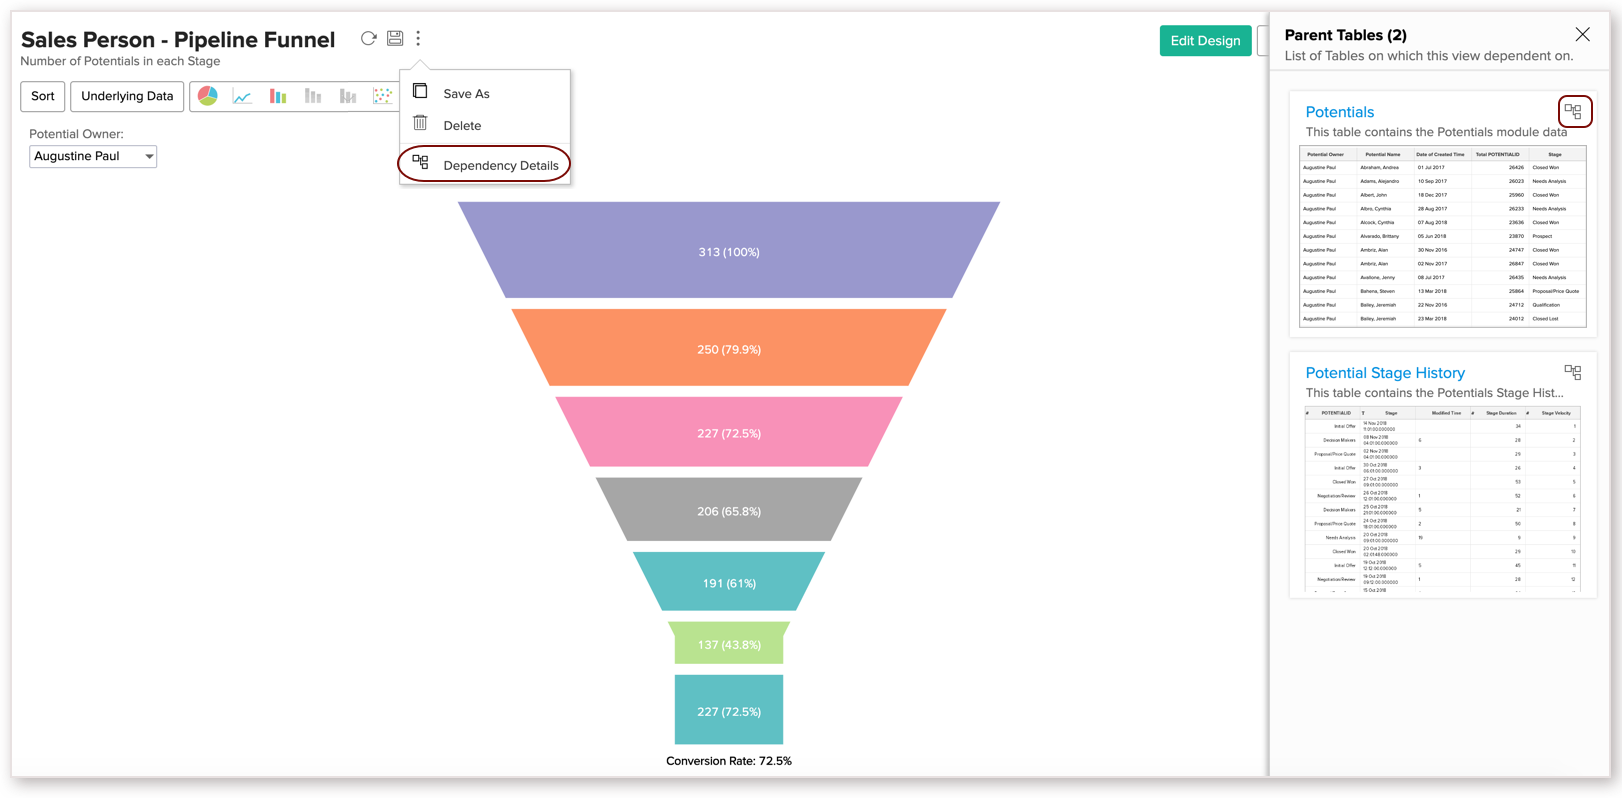
Data Snapshot periodically snapshots the data from a chosen report, and stores them in a table, for historical report creation & analysis. Let's say you have a report for Leads by Source and Status. With Data Snapshot, you will be able to track the changes in the leads' status over timestamps such as every month, week, day, or hour and create reports over them. Click here to learn more on Data Snapshot. Get Dependency Details for Views
The following are the dependency details available for each view.
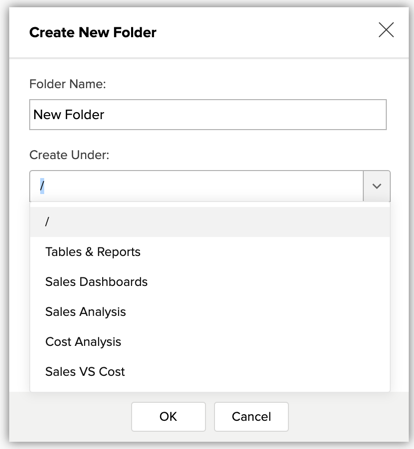
Click here for more details on this. Sub-Folders in Workspace
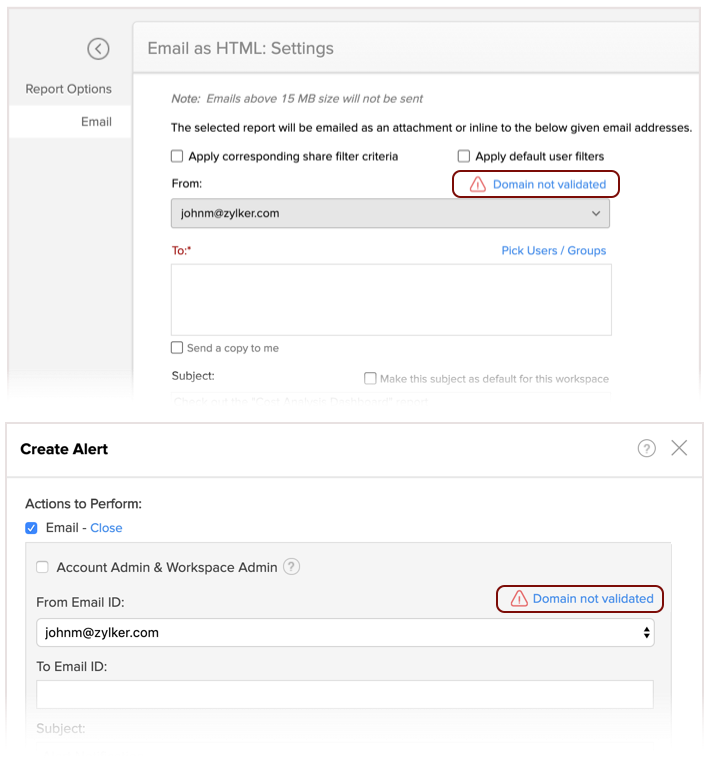
Click here to learn how to create a sub-folder. Notification for Domain ValidationTo enable a secured mailing option (Emailing Reports, Data Alert Mails), Zoho Analytics allows you to send DMARC compliant email. In case you have not validated Zoho Analytics as a valid email source, then you will be notified in the dialog. You can click the Domain not validated link and validate your domain. Click here to know how to validate your domain. Import data from Google Team Drives and Zoho WorkDriveNow you can import data from Google Team Drives and Zoho WorkDrive. This allows you to import data from your business account. Click here to learn how to import from Google Team Drives and Zoho WorkDrive. Tags Module supported in Teamwork Projects ConnectorAdvanced Analytics for Teamwork Projects now supports synchronizing data from the Tags module. For more details about the Teamwork Projects connector, click here. |
Oct 16, 2019 | |
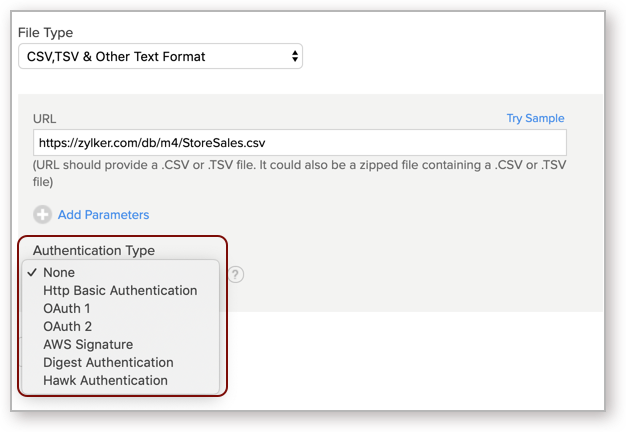
More Authentication Types for Web Import
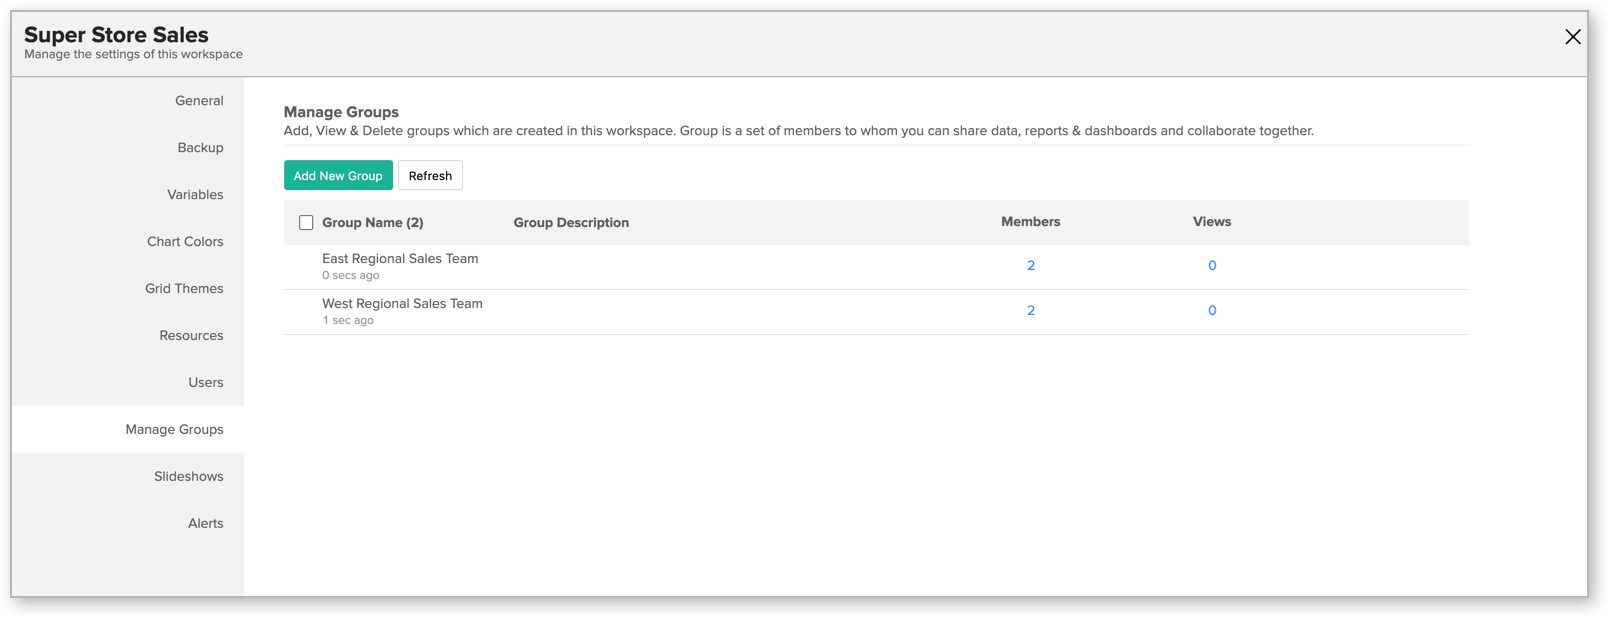
For URL authenticated using OAuth 2 Authentication, you can now specify the Grant Type. Groups UI Revamped
Click here to learn more about Groups. |
Sep
Sep 13, 2019 | |
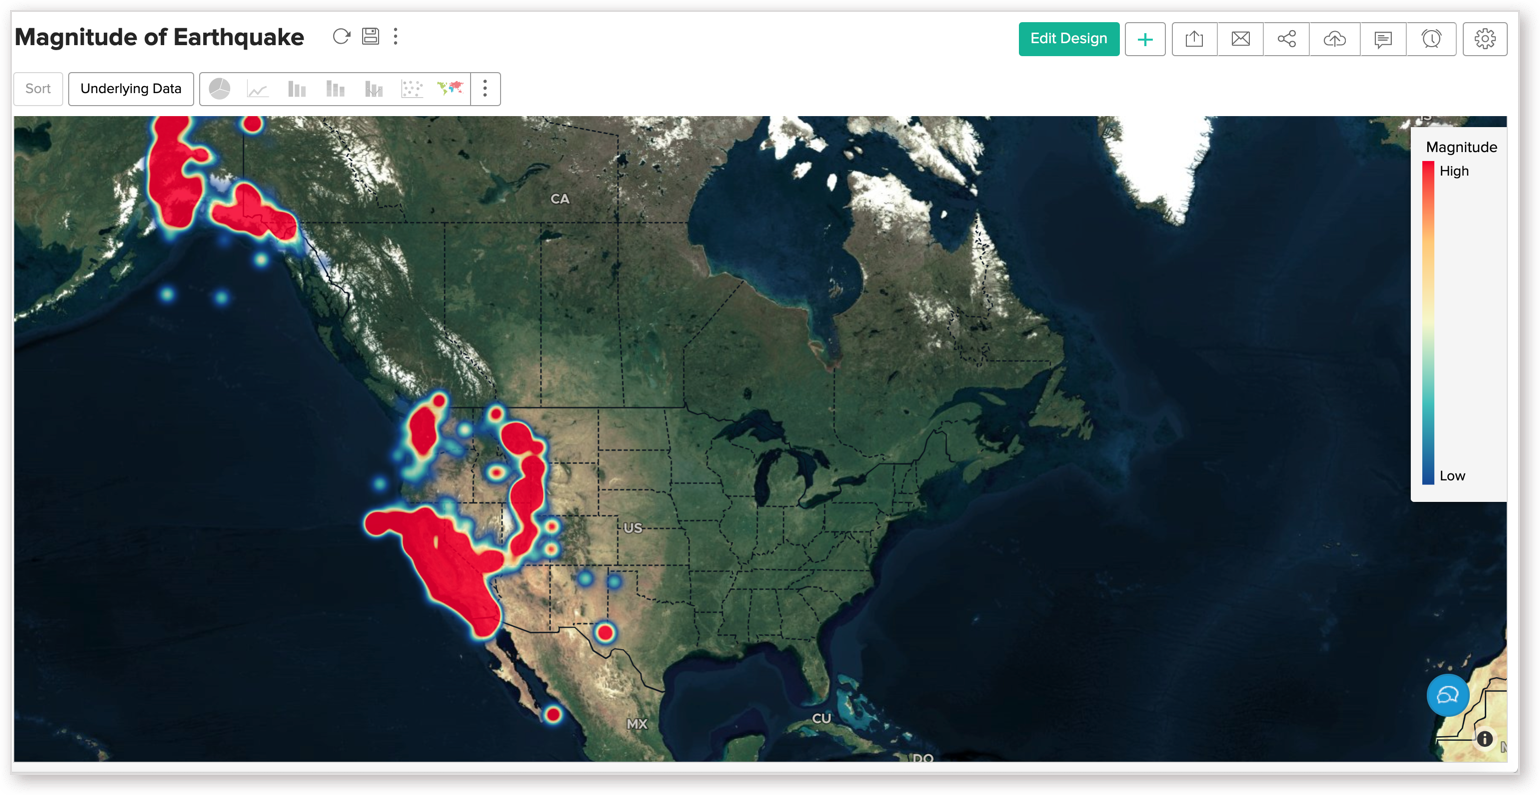
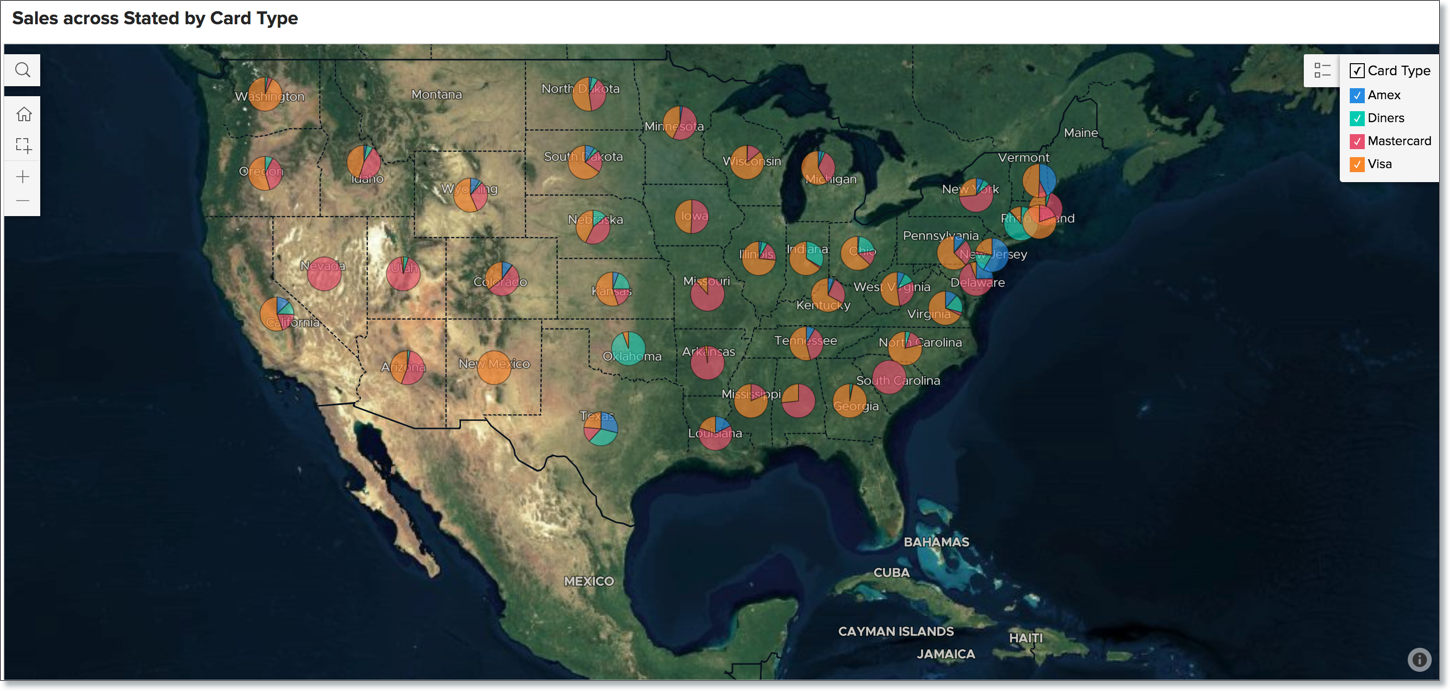
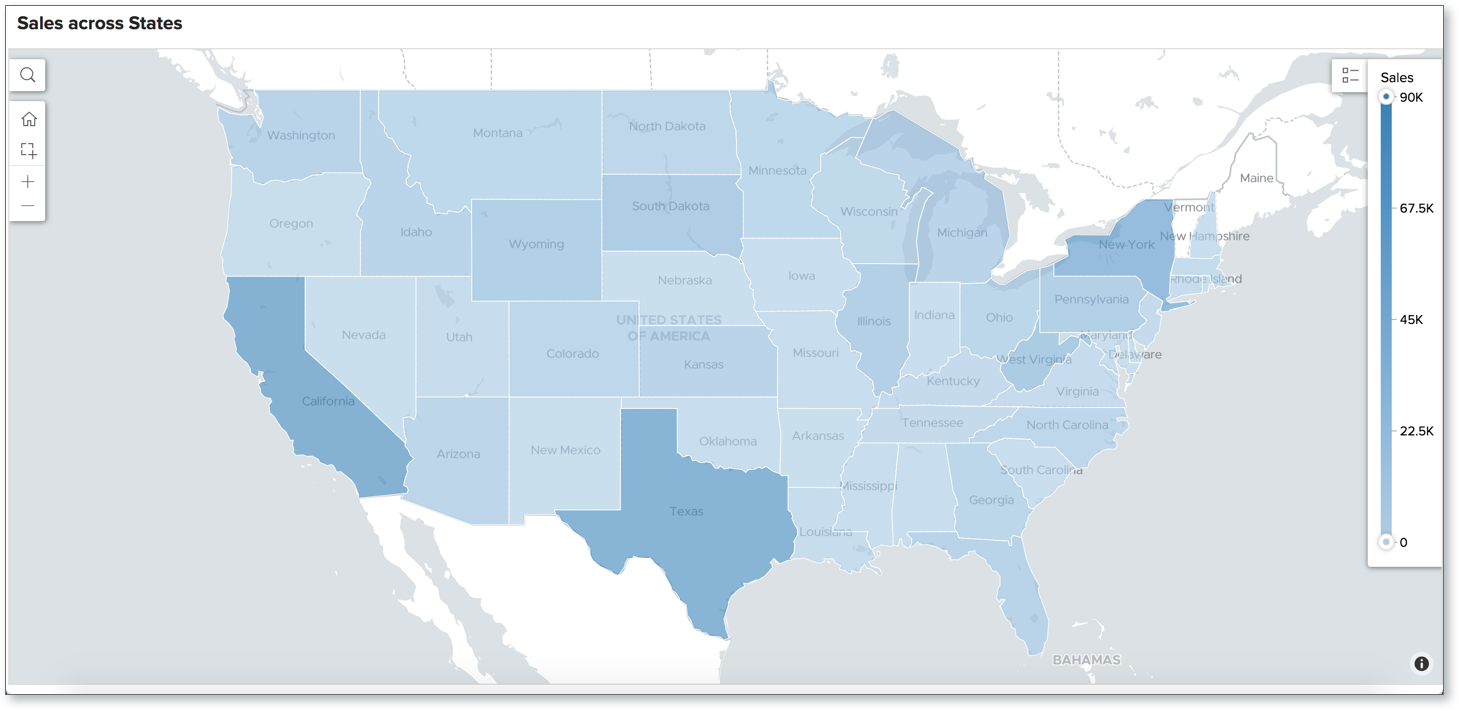
Introducing Geo Heat Map
|
Aug
Aug 2, 2019 | |
Emailing Reports - Recipients Limit Extended
Number of recipients for emailing reports & dashboards has been raised from 5 to 25. You can now specify upto 25 recipient mail ids when you mail reports. You can also add Groups as recipients and no longer need to enter all email addresses every time. Selecting multiple views made easy
Shift + Click short cut key can now be used to easily select a contiguous list of views easily in the Explorer. |
Aug 14, 2019 | |
Advanced Analytics for Shopify
Advanced Analytics for Shopify provides you in-depth e-commerce analytics on your store data in Shopify. With this connector, you can effectively track key business metrics such as product performance, shipment handling, customer preferences, order transactions, inventory management and many more.... This connector is bundled with 100+ pre-built reports and dashboards that provide deep driven insights to grow your e-commerce business. Apart from the pre-built reports, you can also easily create your own ad-hoc reports & dashboards based on not only your Shopify data but also by blending data from other data sources. Zoho Inventory & Zoho Subscriptions - New Addition to Zoho Finance Analytics
Now Zoho Finance Analytics extends support for Zoho Subscriptions and Zoho Inventory services (in addition to Zoho Invoice and Zoho Books). With Zoho Subscriptions Analytics, you can get a visibility into your subscription transactions with in-depth analytics. You can track subscription trend, customer growth trend, revenue growth, average customer lifetime, cancellations, and customer churn rate. And for Zoho Inventory, you can get insights on sales returns, product inventory, warehouse items, packages and shipments. You can do a deeper analysis of your stock handling for an effective inventory management. From now on, you can also analyze data from joined organizations in Zoho Finance Suite (Zoho Subscriptions and Zoho Inventory along with Zoho Books or Zoho Invoice). Report Formula Enhancement
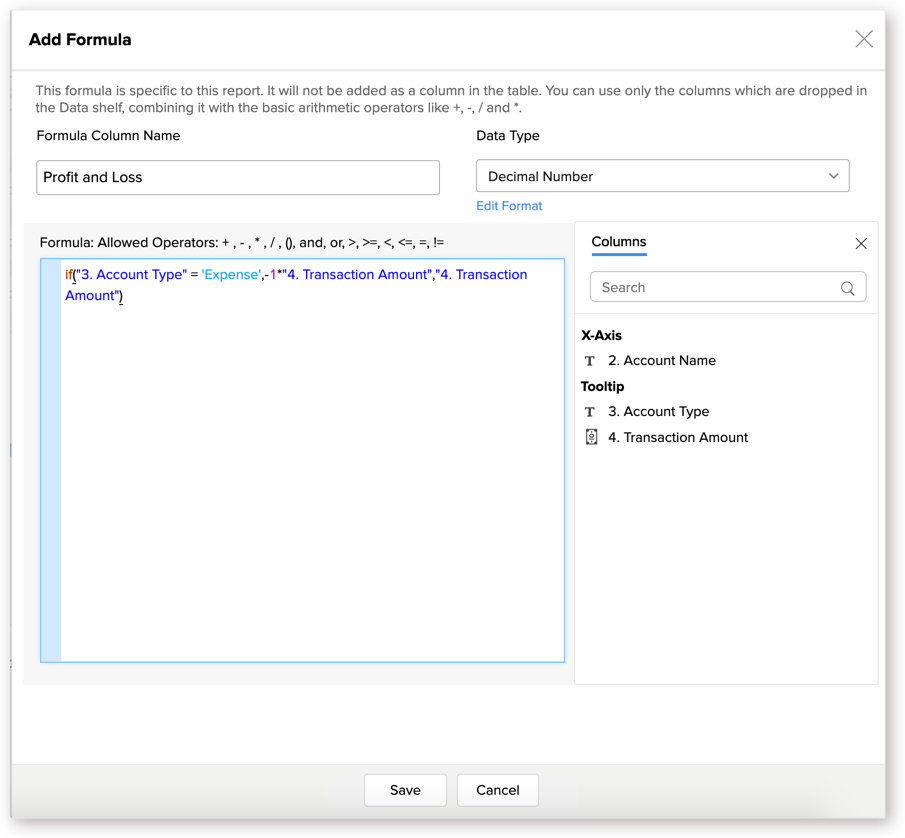
Report Formula now supports formula based on IF conditions. With this, you will be able to construct a Report Formula containing logical conditions (expressions) You can use the following logical and comparison operators hence forth in your expressions:
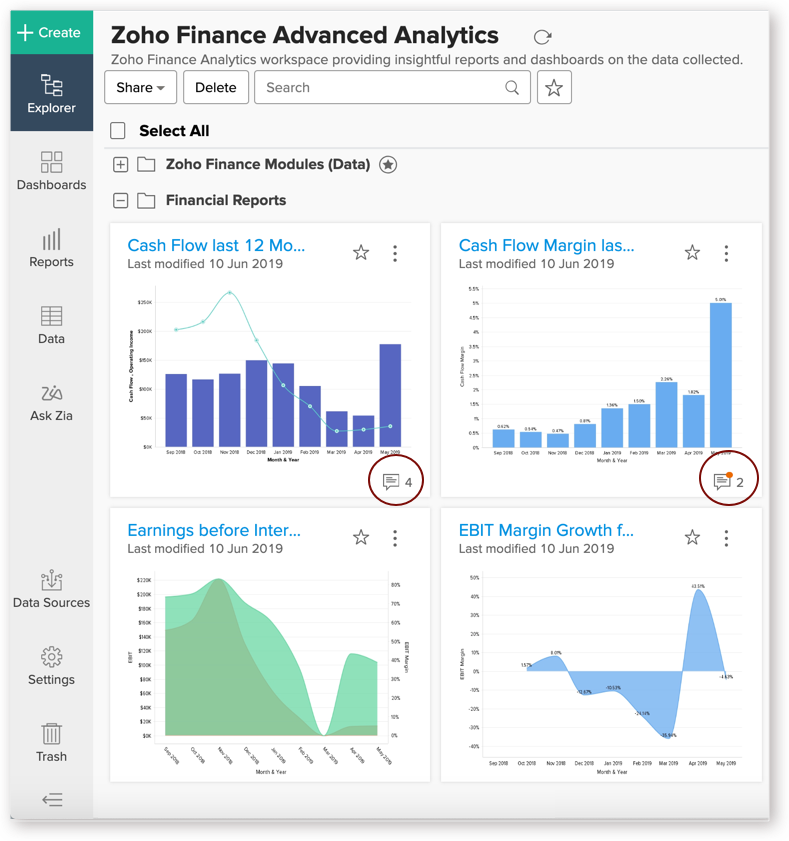
Comments widget in View Cards
This widget will also highlight unread comments with a red dot to get the user's attention. |

Aug 21, 2019 | |
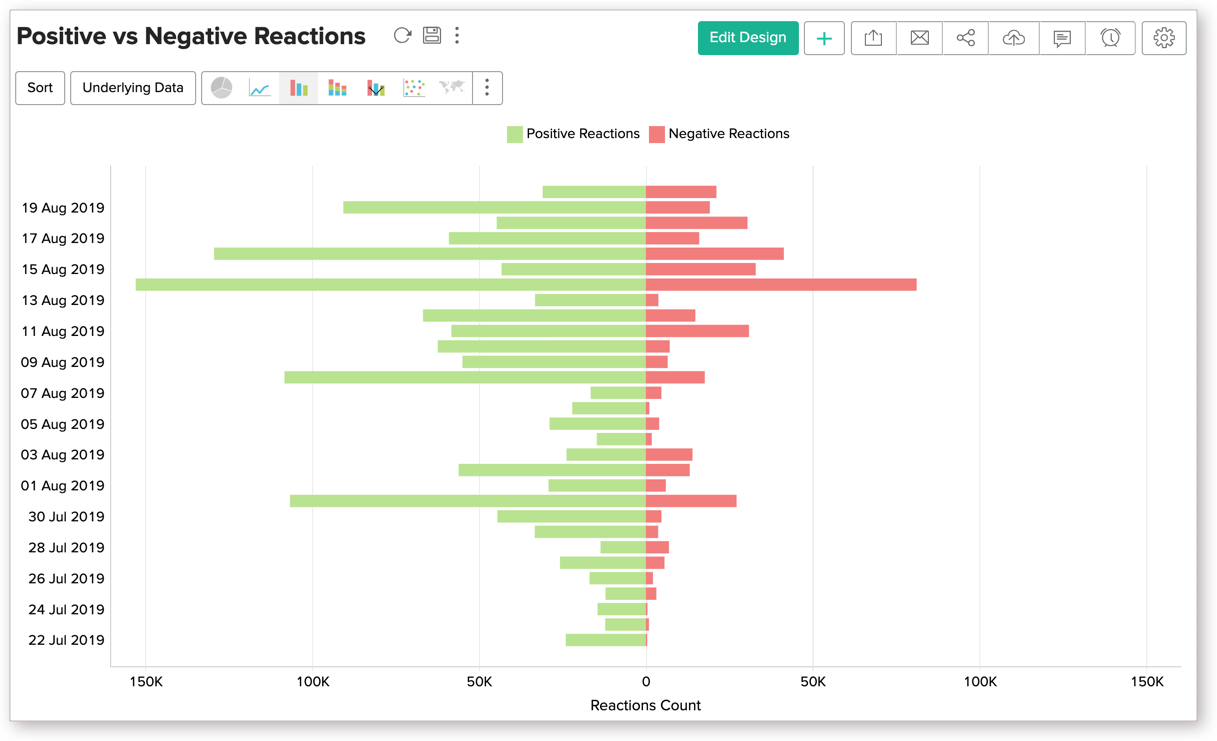
New Butterfly Chart
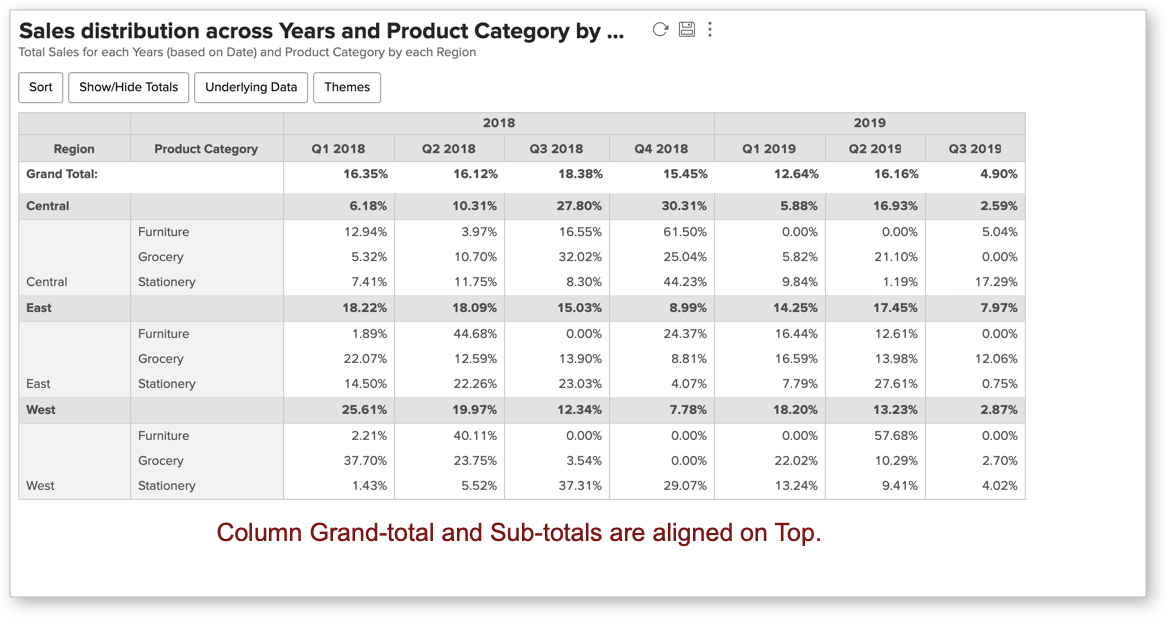
Zoho Analytics now supports a new chart type, Butterfly chart (also be referred as Tornado chart or Divergent chart). This chart will be plotted as two horizontal bars with the same X-axis in the center, resembling the butterfly wings. This will be useful in comparing contrasting data sets such as male vs female, income vs expense, positive vs negative, completed on time vs overdue etc., easily. Click here to learn more. Customize Pivot Summary Position
Now you can customize the position to display the summaries (Sub-Totals and Grand-Totals) in Pivot Table. You can choose to display a row summary either on Right or Left position. Similarly, you can display a column summary either in top or bottom position. Click here to learn more. |
Aug 28, 2019 | |
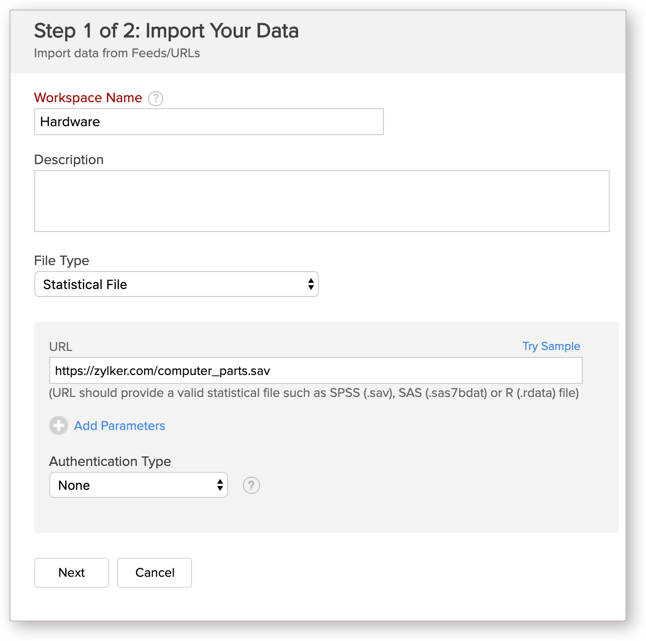
Import Data from Statistical Files
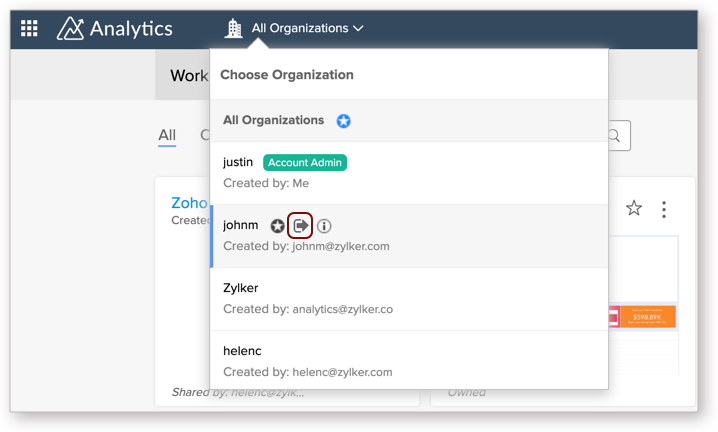
Import from more Local Databases with Zoho DatabridgeZoho Databridge now extends to support importing data from the following databases. Unsubscribe from Shared Organization and Workspace
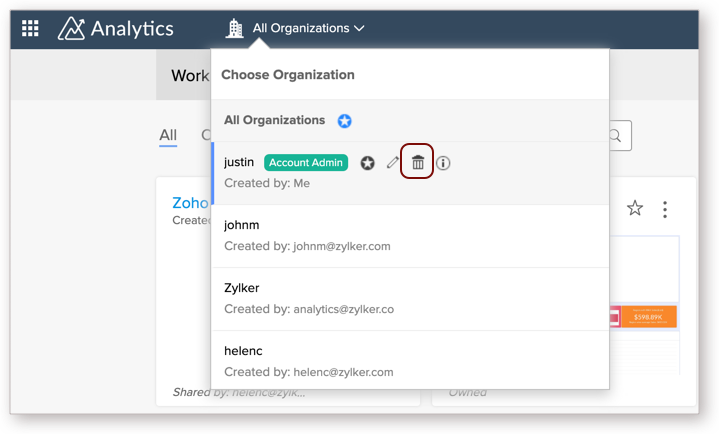
Click here to learn how to unsubscribe from shared Organization and Workspace. Delete Own Organization
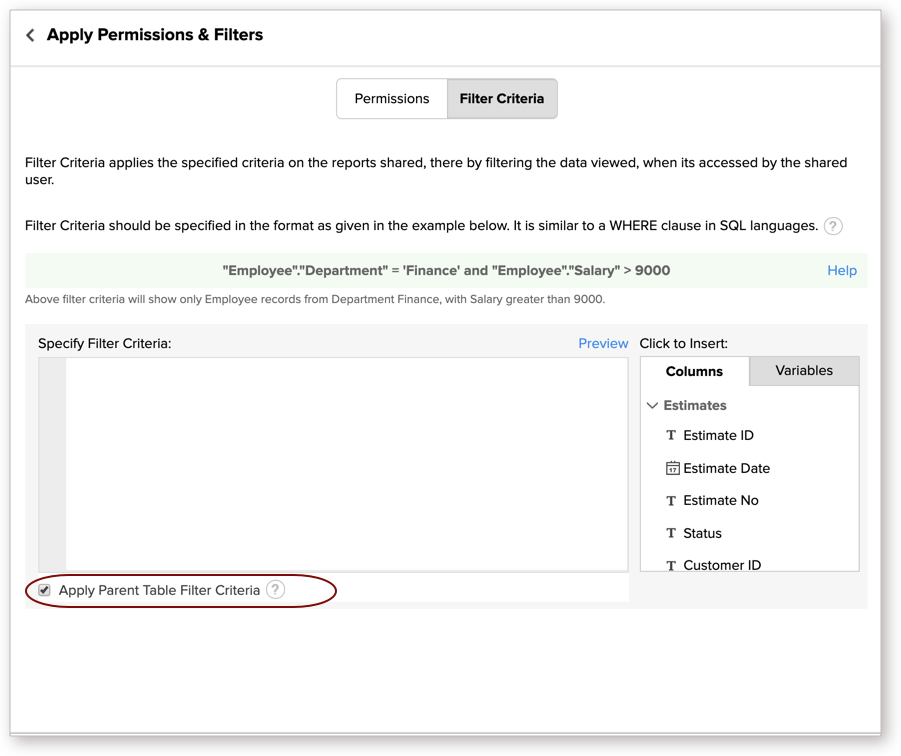
Click here to learn how to delete Organization. Apply Parent Table Filter Criteria while Sharing Dashboards If you have shared a table (parent table) with a specific filter criteria to a user. Let's say you are sharing a dashboard, with dependent views embedded in it, to the same user. You can now choose to apply the parent table's filter criteria to the dashboard. When you apply this option, share filter criteria in the parent table will be joined with the share filter criteria specified for and the dashboard, using AND option. Click here to learn more. |
Jul
July 17, 2019 | |
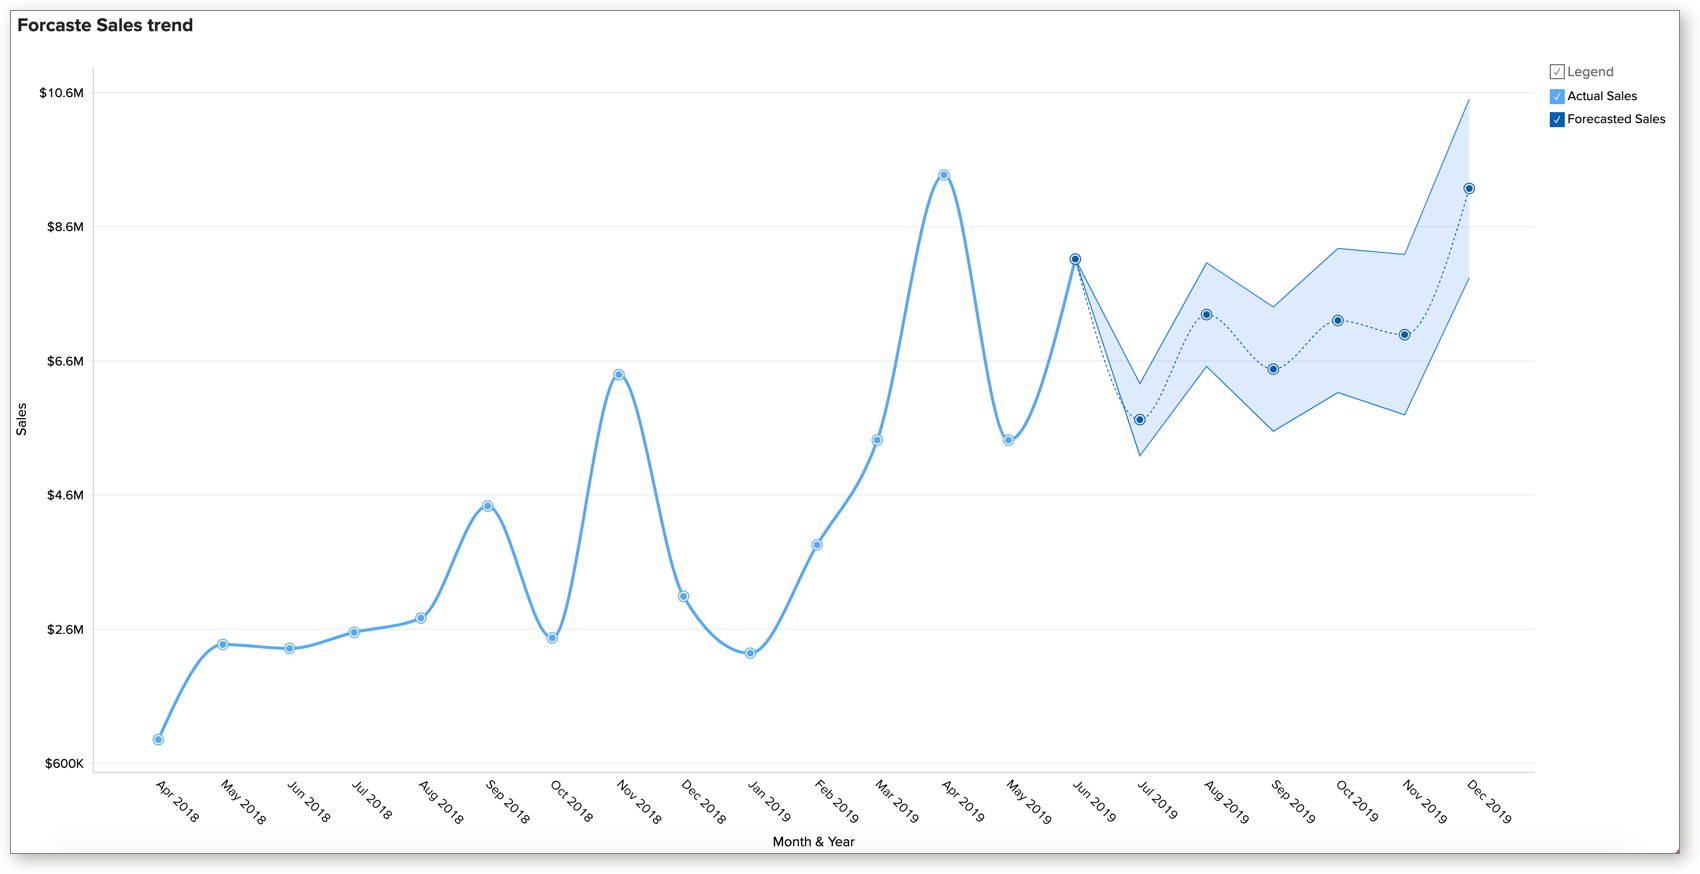
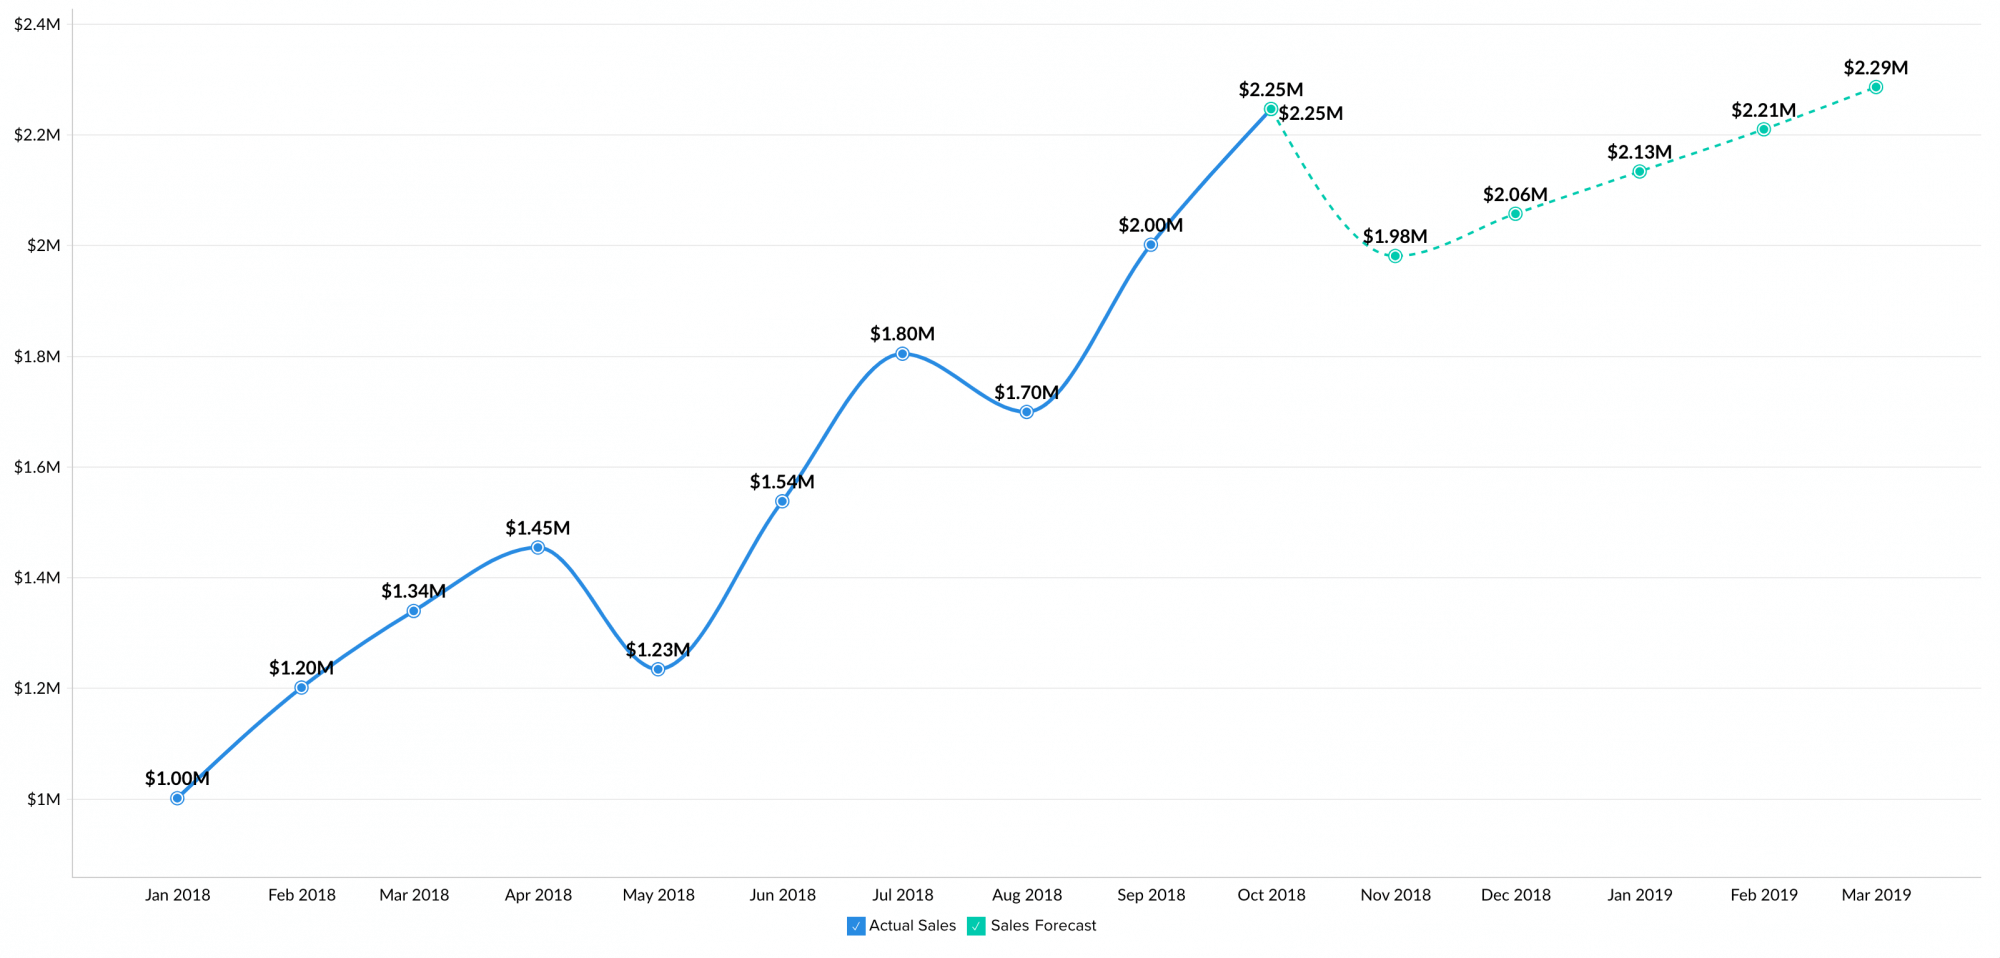
Prediction Interval for Forecasting
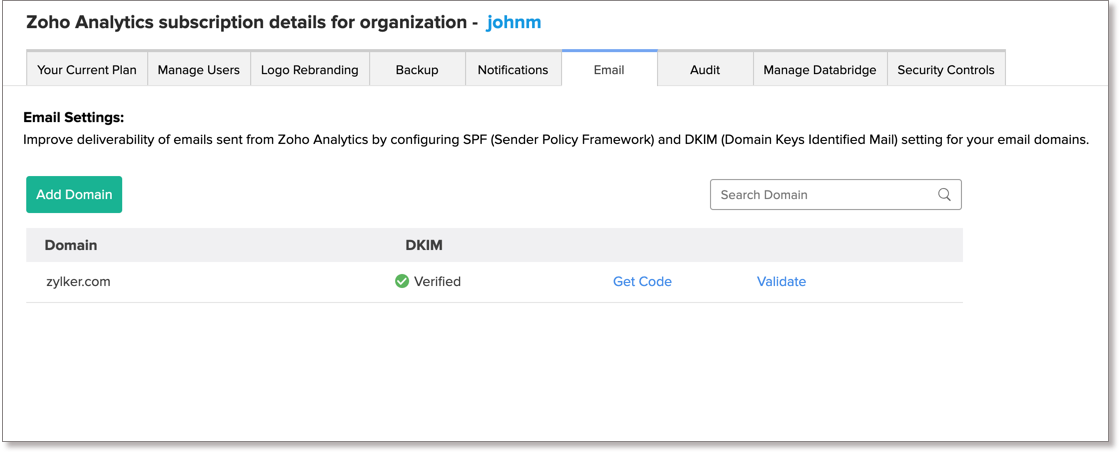
Send DMARC Compliant Emails
The Email Settings allows you to configure Zoho Analytics as a valid email source to send mail using your email address. With this, you indicate that the emails sent by you using Zoho Analytics aren't spam. Click here to learn how to configure the email settings. Chart Color Palette Revamped
Double-click to Rename Table Column Now you can easily change the column name of a table by double-clicking the column header. |

July 23, 2019 | |
New Data ConnectorsWe're happy to announce that Zoho Analytics is enriched with two new Advanced Analytics connectors: Advanced Analytics for YouTube Channel and Facebook Competitive Analytics. Advanced Analytics for YouTube Channel
Advanced Analytics for YouTube Channel allows you to monitor and grow your YouTube channel by analyzing its performance with powerful insights. You can measure video engagement by analyzing your audience interaction such as likes, comments, shares, favorites, and watch time, to know what type of content resonates with your target audience. Also explore traffic stats to get deeper insights like geographic distribution, gender profile, device usage and lots more, which will let you tailor your content accordingly. The Advanced Analytics for YouTube Channel includes 50+ prebuilt reports and dashboards. Facebook Competitive Analytics
The Facebook Competitive Analytics connector enables you to analyze and compare the performance metrics across multiple Facebook pages. Marketers can use these insights to study how their page performs in comparison to the competition or with other pages. You can derive key insights to validate competitors' influence and benchmark your growth against them. You can also measure competitors’ engagement (their success and failure) to make sure you are in track with the trend and learn how to be ahead of them. The Facebook Competitive Analytics connector includes a wide range of prebuilt reports and dashboards to get your analysis started immediately.
Apart from the prebuilt reports & dashboards bundled in each of these connectors, you can always create your own ad-hoc reports & dashboards using the easy to use drag & drop interface. You can also blend data across other sources to get end-to-end insights. |

May
May 8, 2019 | |
Dashboard Layouting made easy
Dashboard layout has been enhanced with the following flexible layout options:
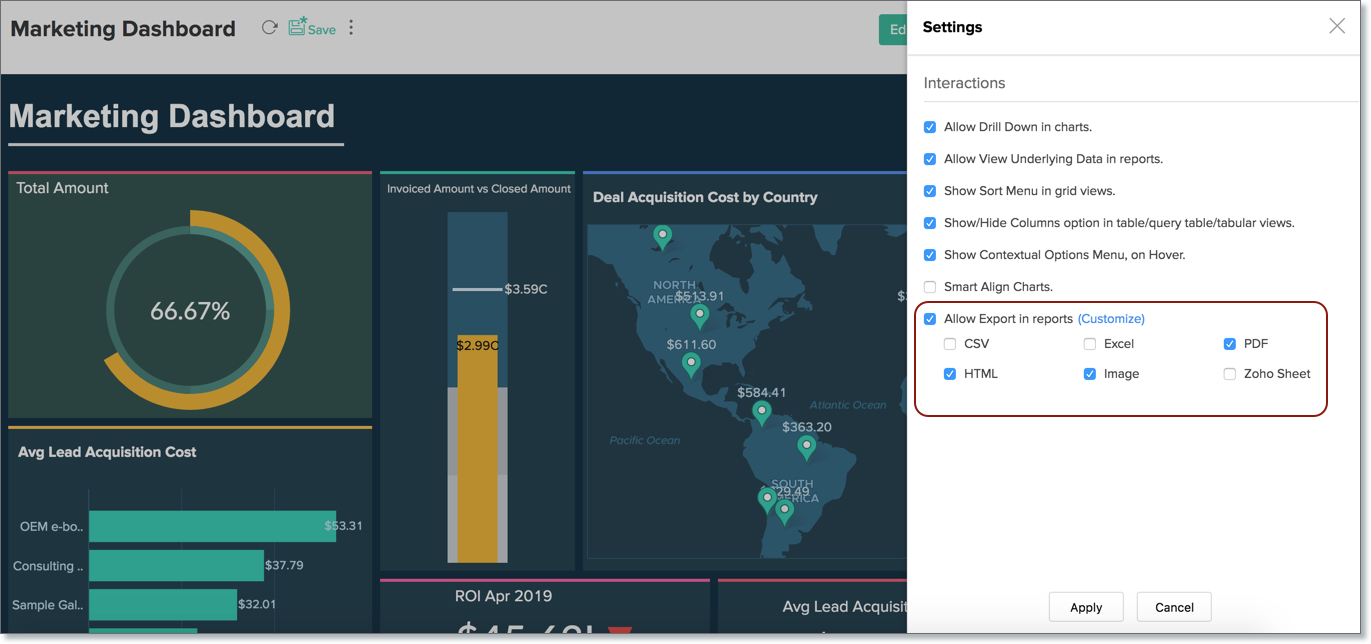
Allow Export for Reports in Dashboard
A new option to enable or disable export options for the embedded reports in the dashboard is now added in the Dashboard Settings. You can also choose the export file formats to allow using the Customize link. Maximize Embedded Report in Dashboard
Now Zoho Analytics allows maximizing the embedded report to view in full dashboard layout. You can also open the report in edit mode from the dashboard. |
Apr
April 3, 2019 | |
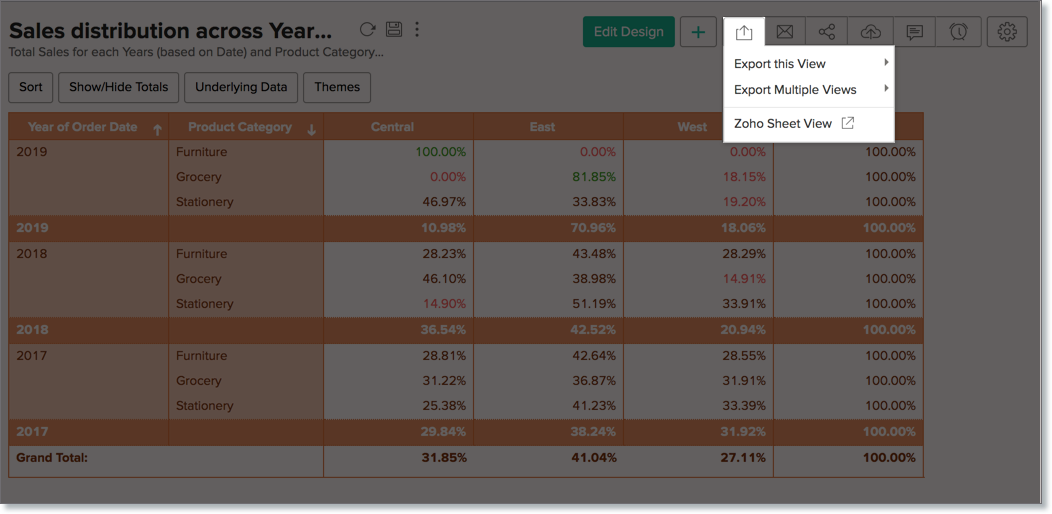
View Report in Zoho Sheet
Now you can view the Zoho Analytics view in Zoho Sheet. The data in each of the view will be displayed in Zoho Sheet retaining the same structure. In the case of Chart, only the underlying data will be displayed and it will not be displayed as a chart visualization The following view types can be viewed in Zoho Sheet.
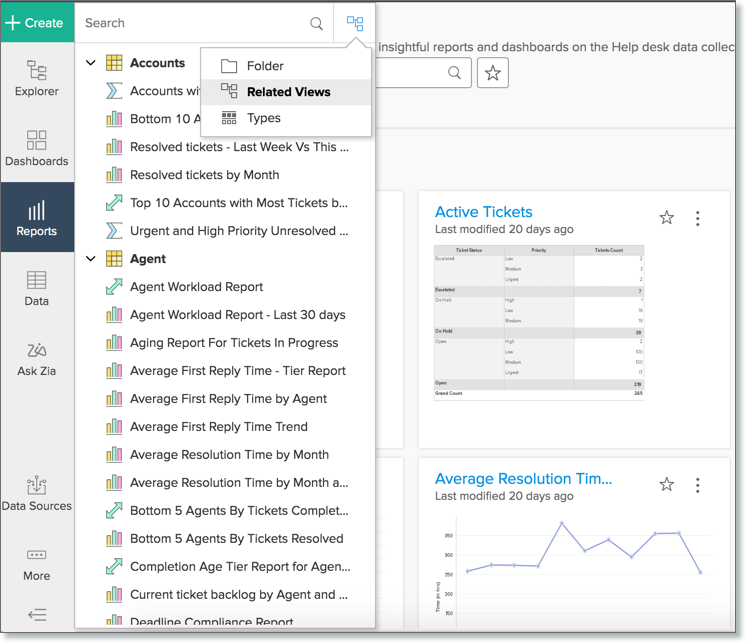
For more details refer here. Organize Views in Navigation Panel
Now you can choose to organize the views listed in the Data, Reports, and Dashboard navigation panel. The view list can be organized in one of the following order.
For more details refer here. |
April 26, 2019 | |
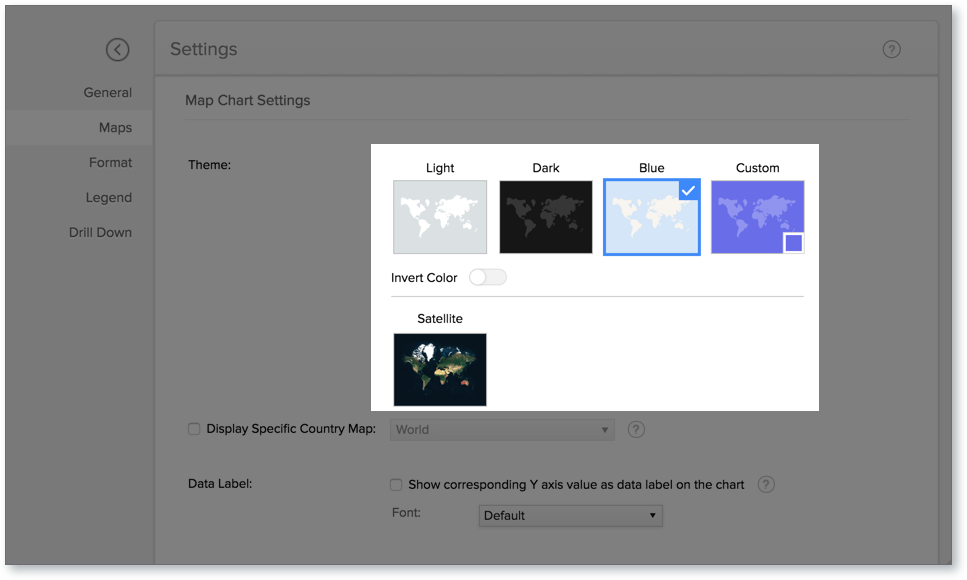
Geo Maps Visualization EnhancementsZoho Analytics Geo Map Visualization has been enhanced with the following features. New Map Themes
Map themes have been enhanced with Satellite map theme and a custom theme. With Satellite map theme you can now plot a geo map chart over Satellite map. The custom theme allows you to design a theme with your own colors and apply the same on a map chart. The map themes now support an option to invert the land and water color using the Invert Color toggle button. This is applicable for all theme except Satellite map.
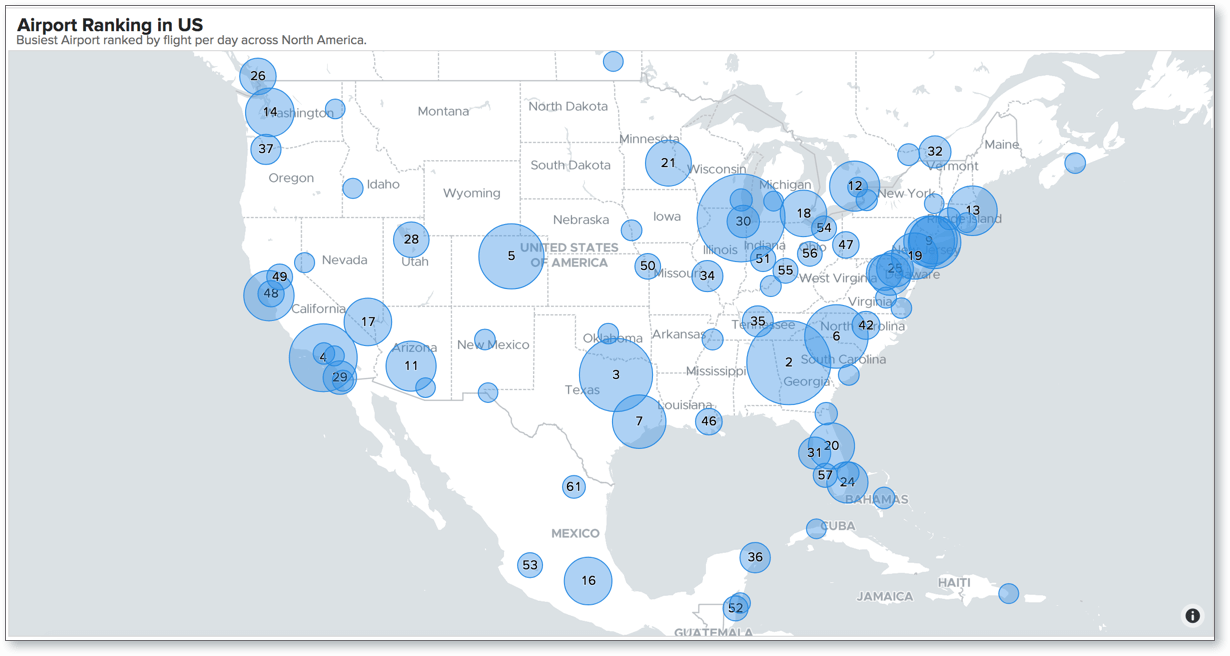
Airport IATA CodeAirport IATA Code in your data will now be recognized by Zoho Analytics as another geo type column. With this, you can create reports based on airport data.
Multiple Country MapThe country-specific map now allows selecting multiple countries in geo maps. Now you can display the map of the countries that are applicable to you and hide the rest.
Continuous Legend
Now you use a continuous color range legend for map chart and categorize the data values using color range. This will be pretty useful for visualizing data based on the volume of occurrence. Import EnhancementsImport Data from more Cloud DatabasesNow Zoho Analytics allows you to import data from the following Cloud Databases
Import data from Files and FeedsData Import from local files and web/feed are now separated into 2 different options to simplify the import process.
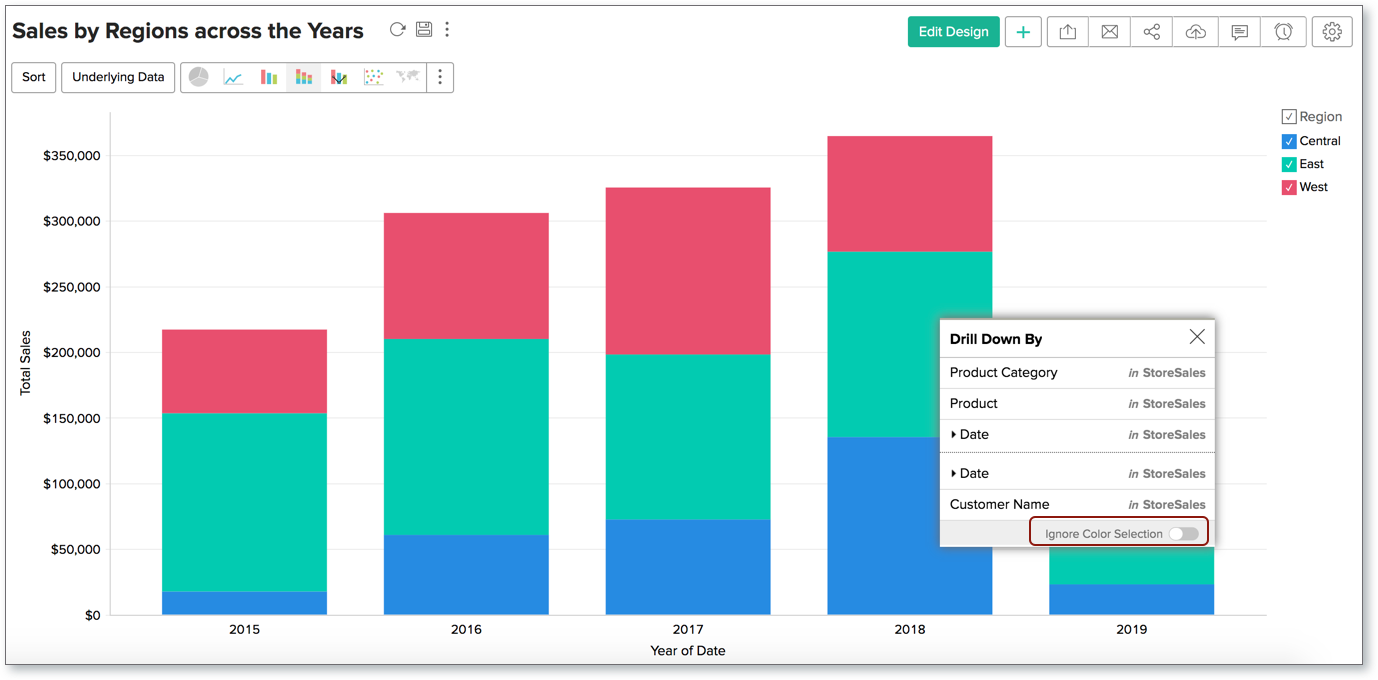
Ignore Color Selection in chart drill-downs
You can now choose to ignore the specific color which you have clicked and drill down the entire data point using the Ignore Color Selection toggle button. |
Mar
Mar 20, 2019 | |
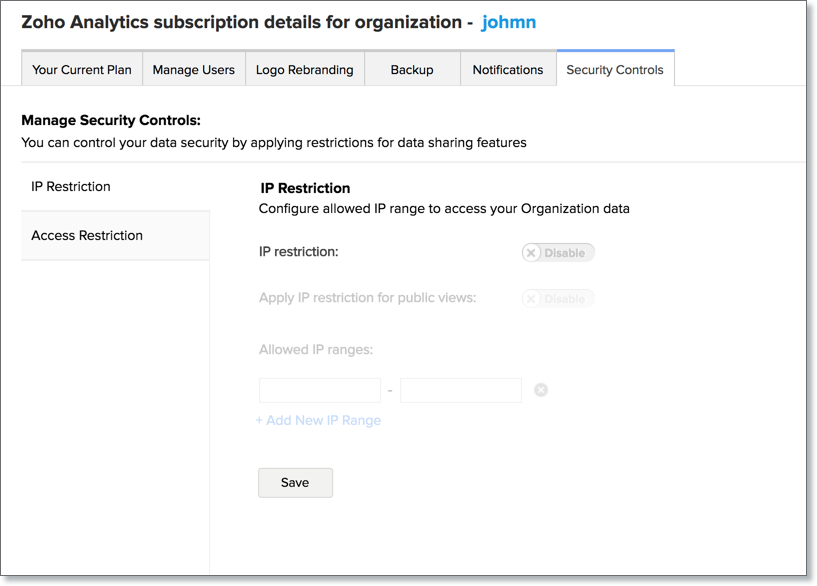
Security Controls Options
Zoho Analytics provides a set of security options that enable you to control and manage access to your account. This includes setting up IP restriction as well as controlling the various sharing & collaboration options being made available.
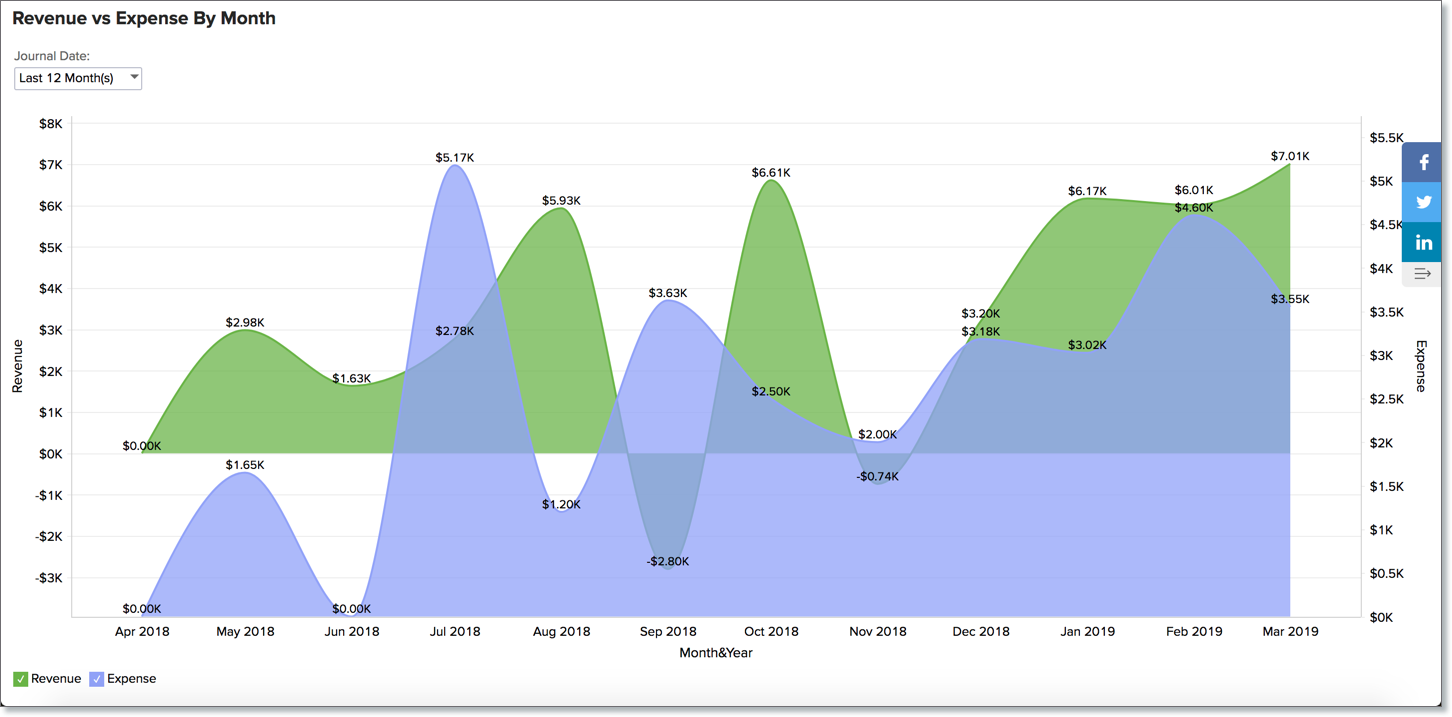
Click here to learn more about security control options. Social Media Widget for Private Views
Now you can add social media widget in the private links (without login) published. This allows user viewing reports/dashboards from private links to share the same into social media channels like Facebook, Twitter, and Linkedin. Click here to learn more about Private Link (Without Login). |
Mar 27, 2019 | |
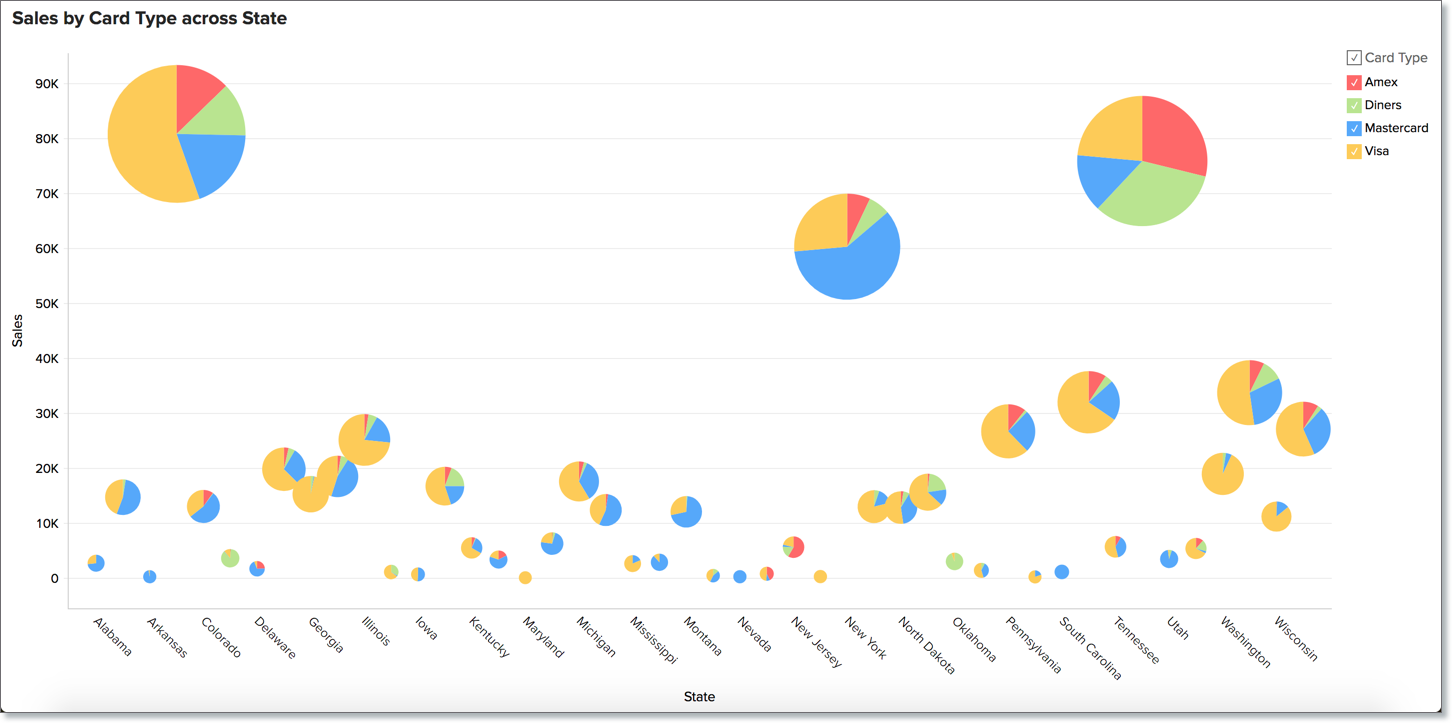
New Chart Type - Bubble Pie
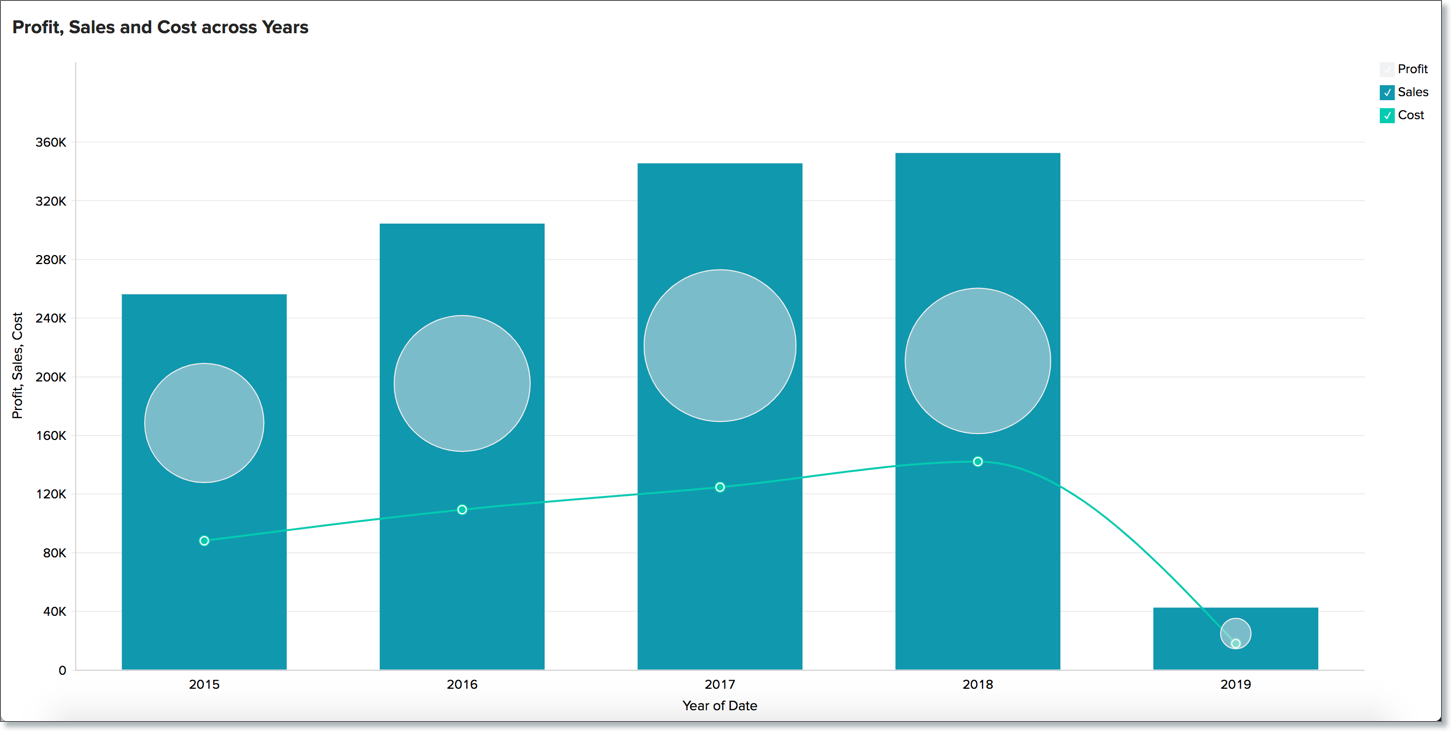
A new chart type called Bubble Pie Chart is now added. This is a combination of pie and bubble charts. The data column dropped in the Size determines the size of the bubble. Other aggregation will be plotted as a proportional division of the bubble. This will be useful in displaying multiple pie charts to compare the proportion of data across a series. For more details refer here. Combination Chart - More Chart Types Supported
Now Combination Chart supports more chart types. Previously bar, stacked bar, and lines alone were supported. Now more chart types are supported. You can choose two or more chart types in a single report from the given below.
For more details refer here. Enhancements to Advanced Analytics for Google AdsThe Keyword Performance module is now supported in the Advanced Analytics connector for Google Ads. Now data from this module will be synced into Advanced Analytics for Google Ads workspace for analysis. For more details refer here. |
Feb
Feb 8, 2019 | |
Enhancements to Zoho Projects and Zoho Bugtracker connectorsThe Zoho Projects and Zoho Bugtracker connectors have been enhanced with the following options.
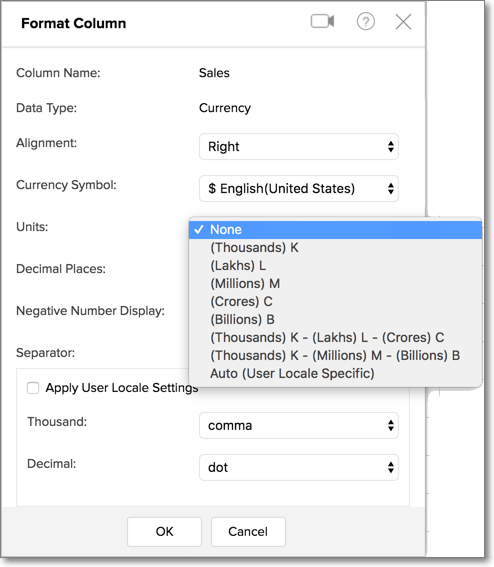
Supports to Format Data as Lakhs and Crores
Zoho Analytics now supports to format the numeric columns as Lakhs and Crores. This will be specifically useful for users from Indian Subcontinent. The following are the new options added to format numeric columns.
Click here to learn about more Formatting Options. |
Jan
Jan 24, 2019 | |
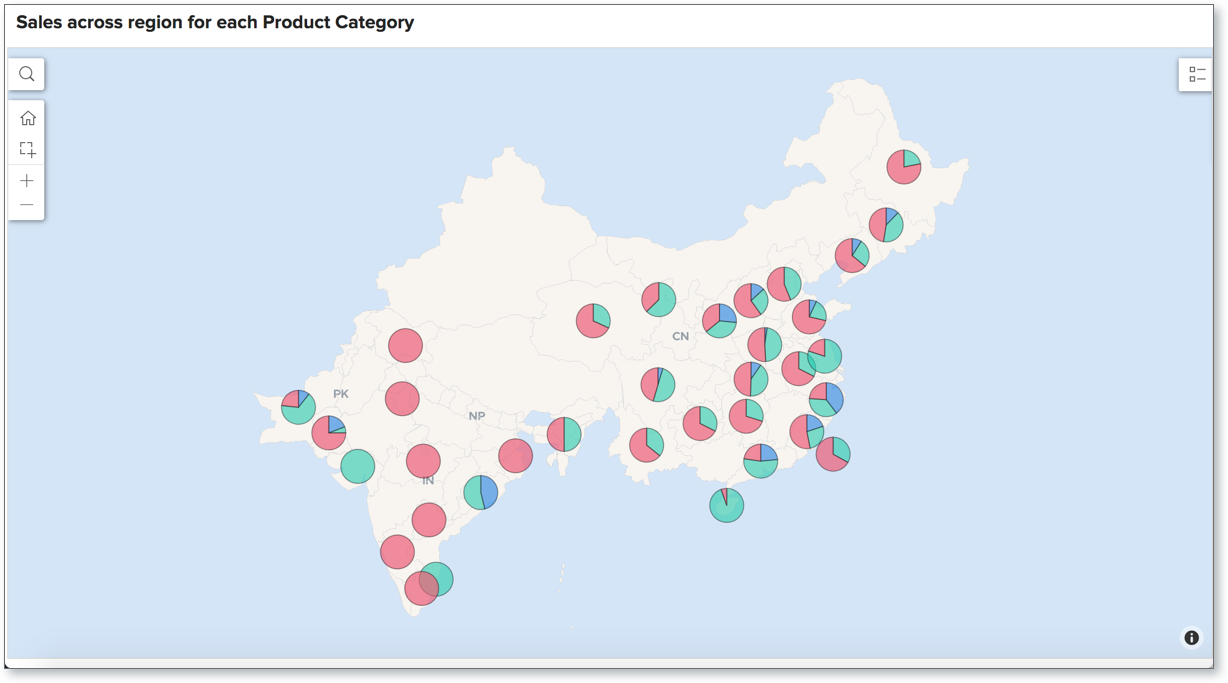
Country-Specific Map ChartZoho Analytics now allows you to plot a country-specific map chart. 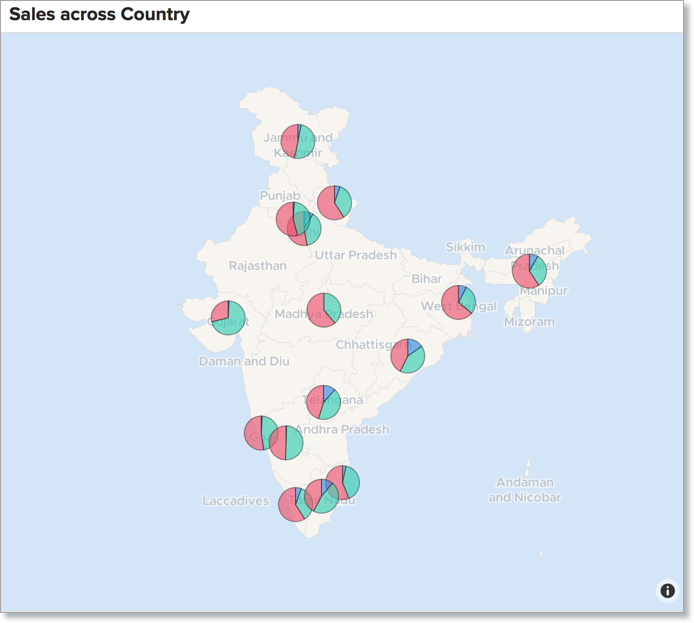 So far, Zoho Analytics displays the entire global map even if you have data for one country alone. Zoho Analytics will autofocus on the specific region alone. However, the neighboring regions will be visible. Now Zoho Analytics allows you to choose a country-specific map. This allows you to highlight the relevant region alone. Support to choose Multiple Lookup Column for JoiningNow you can select multiple lookup columns to join tables for a report. 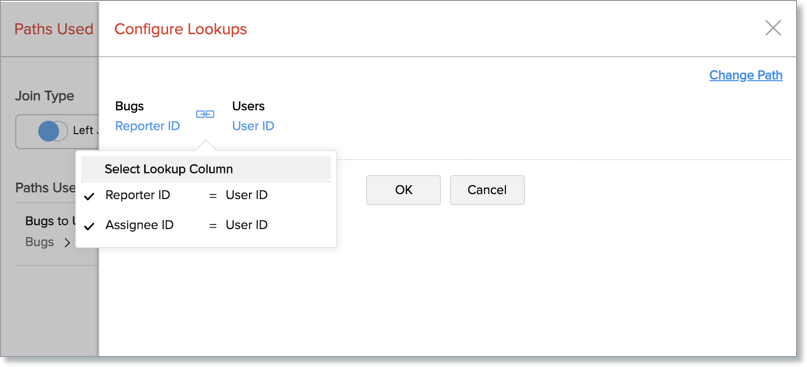 So far, you can select one lookup column to join the data for a report. Now you can also select multiple lookup columns between each pair of tables in a path. This allows you to create report over data that meet multiple conditions. Click here to learn more on this. New 50+ In-built FunctionsZoho Analytics has now added 50+ in-built functions to the library for creating both Formula Column and Query Table. Existing functions are also refined to enhance usability. |
2018
Nov
Nov 15, 2018 | |
Zoho Analytics Release 4.0
We are happy to announce the much awaited Zoho Analytics 4.0 public release. Zoho Analytics comes with several exciting features and a fresh look that you will love. Here is a summary of what's new in Release 4.0. Reporting to Analytics
Zoho Reports is now renamed as Zoho Analytics!! Since we offer in-depth data analytics beyond reporting already, it is only fitting that we make this name change to reflect the power of the product. Refreshed User Interface
Introducing an all new user interface with the following key features. Home PageAll your workspaces in one placeAccess all your owned and shared workspaces in one place. You can preview, search, sort and mark favorite for quick access. Easily access your dashboardsAccess Dashboards across all your workspaces. You can preview, filter and search. View AsView items in the form of preview cards or as a list. Connect to any data sourceOur extensive import options are now grouped for convenience. Theme supportNow we support to customize the Theme for overall product. Learn More about the new Home page. Workspace ExplorerEasy NavigationEasily navigate across all your dashboards, reports and data tables in your workspace. Global SearchSearch across all your views in this workspace using the global search bar. Rename ViewsEasy inline renaming option for views and workspaces. Learn More about the new Workspace Explorer. Personalized Dashboards
Dashboards has got a major facelift. Here are the key highlights. Flexible Dashboard Layouts
Dashboard now supports a flexible m x n layout. With this, you can add multiple views in a single row and have any number of rows. Note: This feature will be incrementally enabled to users very soon. Smart Align WithSmart align option, Zoho Analytics will intelligently auto align the components of the Charts embedded in a Dashboard depending on the space available. This removes clutter and enhances readability. Dashboard Themes PresetsDashboard now offers a set of cool preset themes along with a range of customization options to increase the visual appeal. Learn more Merging User FilterNow you can merge multiple user filters, based on similar text columns from different tables into a single filter. This reduces duplicate filters and enhances user interactions. Learn more Colored KPI widgetsNow you can add background color for your KPI widgets. Ask Zia - AI Powered AssistantAsk Zia is the new search driven analytics assistant. Ask natural questions and get visualization answers. Zia is powered by machine learning and natural language processing. Users can ask Zia questions such as, "What was my monthly sales for the last year across regions?" Zia converts such questions to complex SQL queries in the back end and gives answers in the form of visual reports, without users having to create them manually. Zia can auto-blend data and understand questions that span across business apps - e.g., "Give me the revenue per employee" - where revenue comes from the accounting app, and employee count comes from the HR app. Zia comes up with multiple suggestions as possible answers, from which users can choose the relevant report. Note: This feature will be incrementally enabled to users very soon. Deep AnalyticsAuto Blending of Data
Data is typically siloed in departmental business apps. If a CEO wants to see this month’s new sales, marketing spend, support tickets got, and invoices sent, she has to go to each of the different apps. Let’s say she also wants to know revenue (data in accounting or CRM app) per employee (data in HR app), it becomes even more arduous. This is where Zoho Analytics can help with its intelligent auto-blending capability. Zoho Analytics makes it easier to analyze data from across apps by automatically identifying the connection between this apps and making it easy to create interactive reports and dashboards. Forecasting
Forecasting enables you to easily predict your future data trends. It uses powerful forecasting algorithms which analyzes your past data deeply and comes up with the best forecast for the future. Learn more Smart Data Alerts
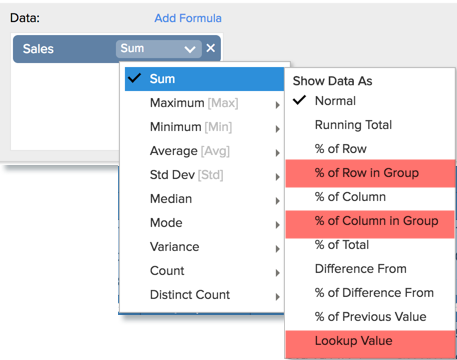
Catch them before it's too late - smart data alerts notifies you of any anomaly or change in your key business metrics as it happens. Configure alerts in a snap, then sit back and relax. Learn More Customizing Lookup PathCustom lookup path selection for every report is now possible in instances where multiple lookups are used. Learn more Report specific formulasCreate a report level formula using "Report Formula" feature to solve a wide range of aggregation challenges. New Summary Functions for Pivot TableNew Advanced Summary Functions, % of Row in Group, % of Column in Group and Lookup Value, have been included in Pivot Table. Learn more New Data Connectors
Zoho Analytics enriches its third-party integrations with seven new connectors for popular business apps, expanding the number of connectors to over 100. Each of these connectors come with more than 100 pre-built domain-specific reports and KPI dashboards that users can benefit from right away.
Enhanced Visualizations
What's analytics without cool visualizations? The following new visualization options have been added to Zoho Analytics to enable you narrate. Geo Map chartZoho Analytics now supports location based analysis with Geo Maps. Learn More Heat map chart Heat map is pretty useful for categorizing and visualizing data based on factors like volume of occurence, intensity, performance scale (bad to good) etc., Learn More Dial WidgetsZoho Analytics now provides full and half dial charts as widgets in Dashboards. These dial charts are the best to visualize a key metric in comparison to the target. Learn More New Color PaletteNew vibrant color palates have been introduced for charts. Default color palate has also been changed. CollaborationContextual Commenting
Collaborative analytics has taken a new form. No more paperwork or lost email threads. Start commenting in real time and make data driven decisions together. Learn more Access LogsZoho Analytics now enables you to track the activity of all users in your account, from administrator to public users, through Audit Logs. Learn more Column Level SharingYou can control what data your users get to see and create reports upon by sharing selective columns alone. Learn More Zoho Analytics On-Premise
Do you have concerns moving data to the cloud for analytics from in-house databases or applications? We heard you. Zoho Analytics now announces the on-premise edition, which can be installed in both Windows and Linux machines. You can easily setup and use in your private network or private cloud. Download now Lots moreNot just the above, Zoho Analytics Release 4.0 is enriched with 50+ new features. As you use the product, you will come across a lot more features. Some key ones:
Try the new Release 4.0. We are sure you will like it. Please do write us your valuable comments/feedback to support@zohoanalytics.com. We would love to hear from you! Note: We are running webinars explaining about what’s new in Zoho Analytics. Please register here. |


Oct
Oct 5, 2018 | |
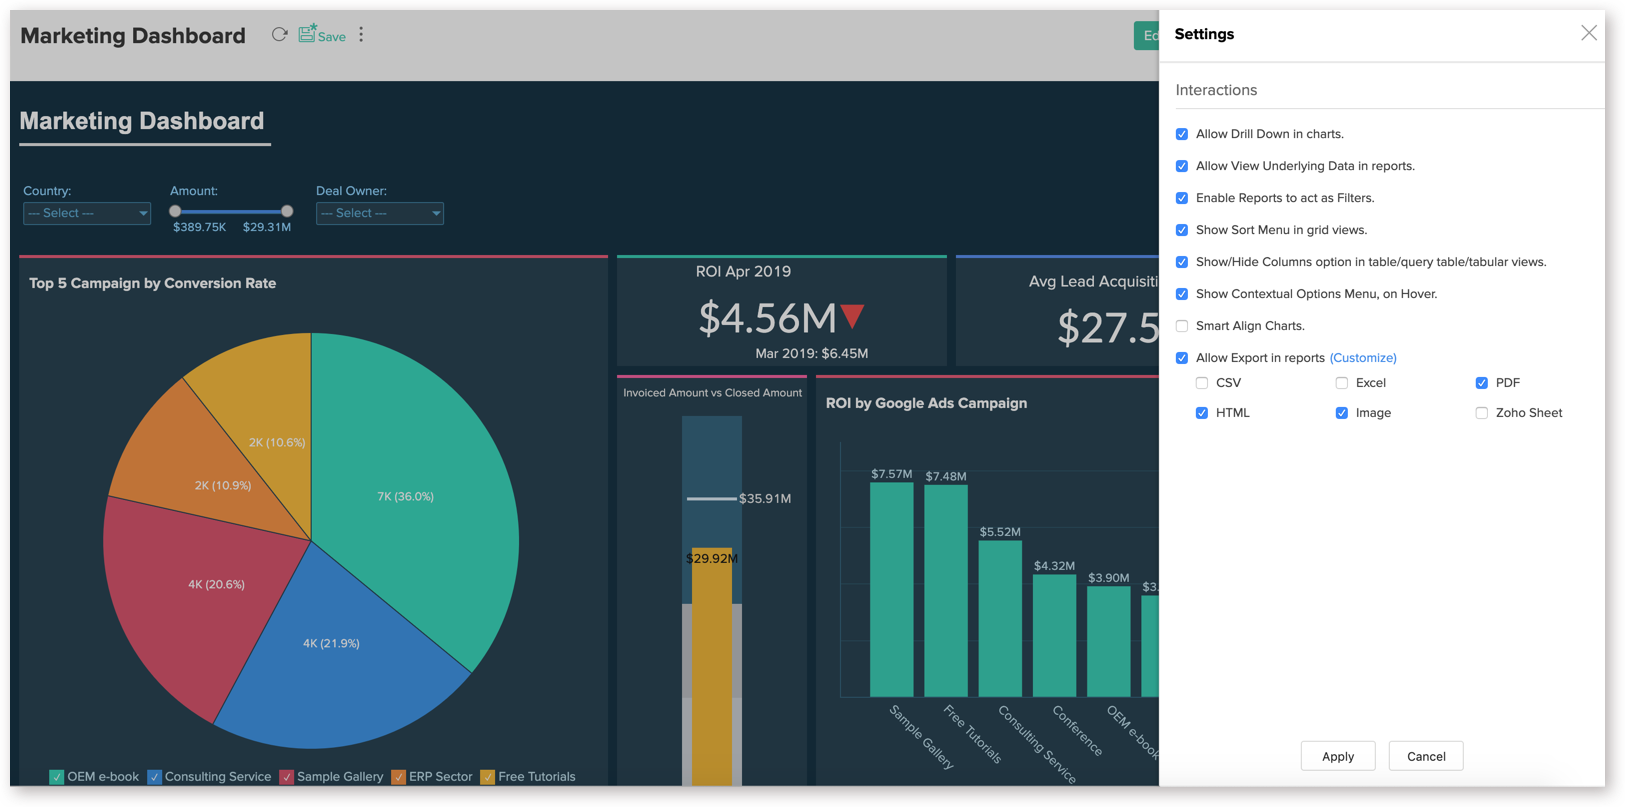
New settings to customize Interactions in Dashboards As part of Zoho Analytics 4.0 release, we are introducing a new set of options to customize the interactions in Dashboards. You can customize the following:
These options are available only in the new 4.0 interface, which is currently in beta. More exciting dashboard enhancements are awaiting in the Zoho Analytics 4.0 release. Stay tuned... |
Sep
Sept 4, 2018 | |
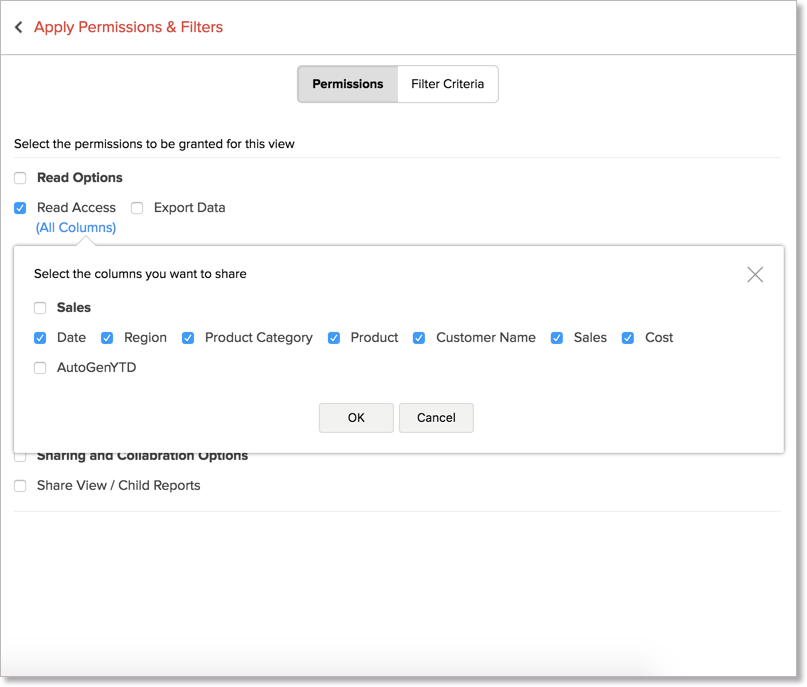
Share Selective Columns from your Tables
Zoho Analytics now allows sharing selective columns from your data table to your users. So far when you share a table all the columns will be shared to the user. Now you can choose columns to be shared. This enables you to control what data your users get to see and create reports upon. This will particularly helpful in case you have sensitive data in your table. Click here to know how to share selective columns. Merging User FiltersZoho Analytics now allows you to merge multiple user filters (Text Column) into a single a filter. The below animation shows merging User Filters.
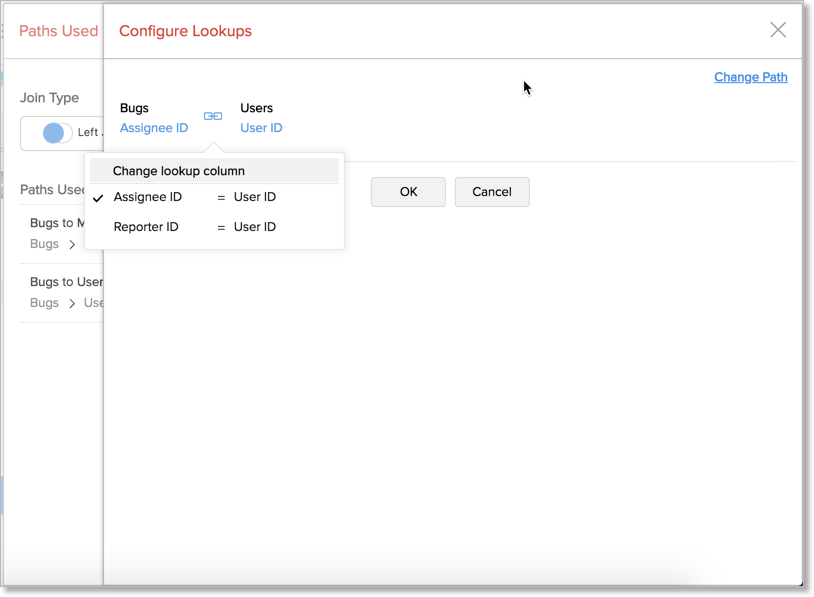
Merging User Filters is pretty useful when you have a dashboard with reports created over similar columns from different tables. So far, the Dashboard User Filters are bound to a specific column in a table and will only filter the reports based on them. Now, this can be overridden. You can map similar columns into a single User Filter to filter all reports using the Merged User Filter. This avoids the tedious process of adding multiple User Filter and filtering the dashboard back and forth. Only user filters which are based on Text column types (categorical columns) can be merged. Click here to know how to use the Merging User Filters option. Configure Lookup Path
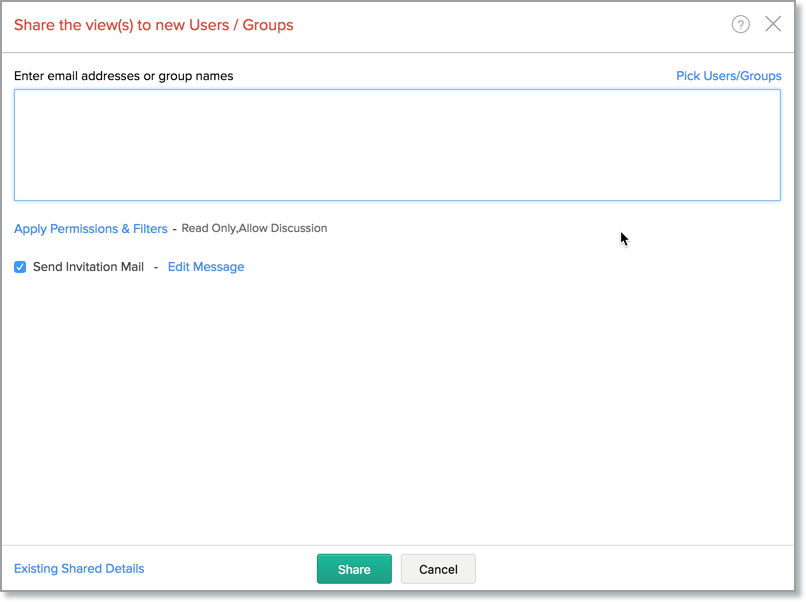
Zoho Analytics now allows you to customize the join path to be used for a report. You might have joined multiple tables using various Lookup columns in your Workspace. When creating reports, Zoho Analytics will use the appropriate Lookup column (Lookup path) created between them and generate the report using the auto join capability. However, in some cases this might not suit your specific need. To address this, Zoho Analytics allows you to choose the appropriate Lookup path between tables to be used for report creation using the Configure Lookup Path option. To know more on this refer, to the Customise Lookup path section. Revamped Share and Formula Dialog interfaceWe have completely changed the User Interface of the share and formula dialogs for an enhanced user experience. Share Dialog
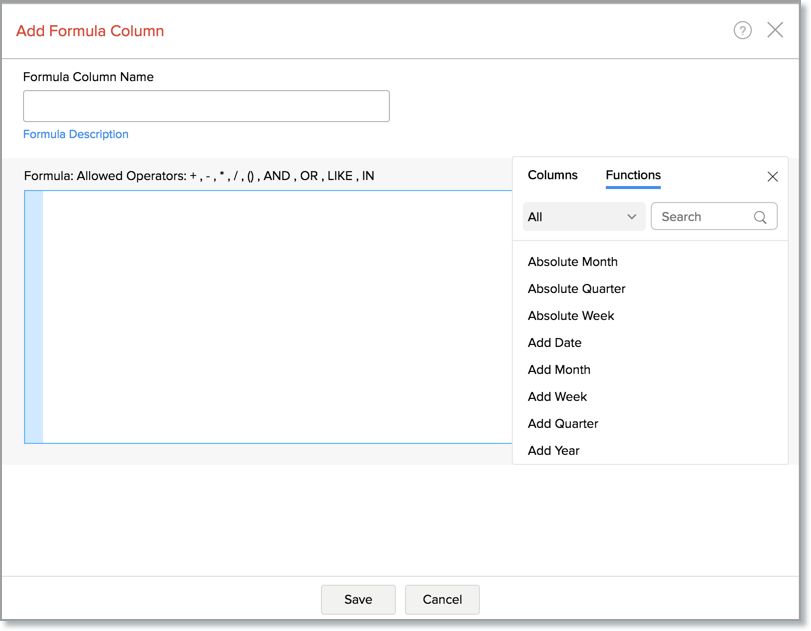
The new Share dialog allows you to quickly share any view as well as customize the necessary settings. For more details refer to the Sharing Views to Users section. Formula Dialog
|
Sept 14, 2018 | |
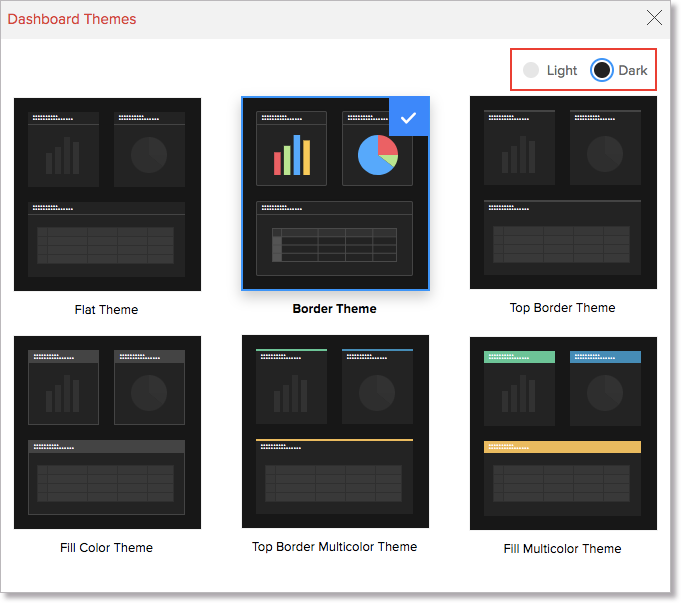
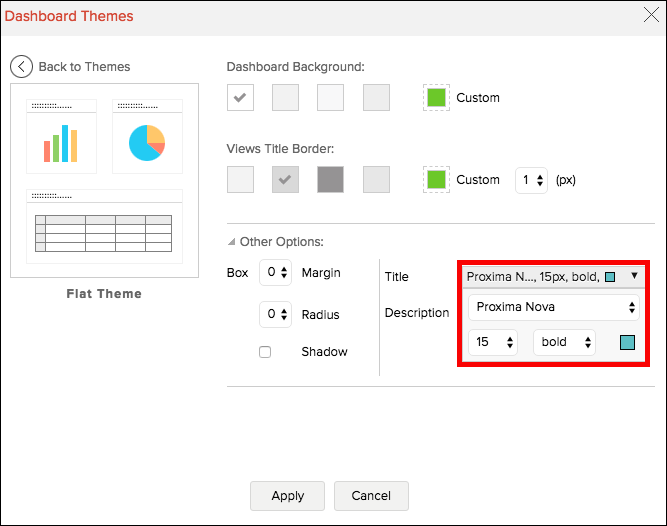
Cool Preset Themes for Dashboards
Zoho Analytics now introduces a set of six cool preset themes for Dashboards. These elegant preset themes applies specific colors for every element in the Dashboard with single click. Previous Dashboard themes were single color based. Customizing themes has also been enhanced now. The entire dialog has been revamped. A new magic band option, to auto suggest matching colors for all elements based on the selected Dashboard background color, has also been added. This allows you to quickly setup a custom theme for your dashboard. |
Sept 19, 2018 | |
New Advanced Summarizing Functions for Pivot TableZoho Analytics now supports the following advanced summarizing functions in Pivot Table to enhance the analytical ability.
Click here to learn more about the advanced summary function for pivot. |
Aug
Aug 10, 2018 | |
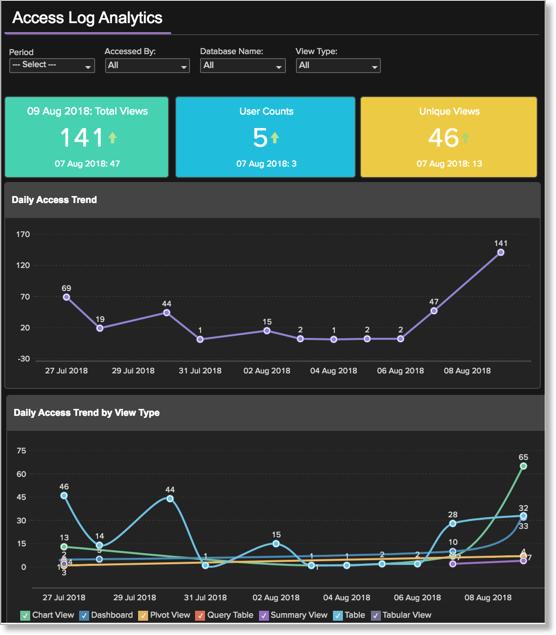
User Access Log Details
Zoho Analytics now enables you to track the activity of all users in your account, from administrator to public users, through Audit Logs. A reporting database will be automatically created in your account and the activity logs will be updated in this reporting database. You will also get an insightful Dashboard, the Access Log Analytics capturing the essentials of user activity such as Daily Access Trend, Access Count by View Type and by Users, etc. This option is available for all paid plans of Zoho Analytics. You can choose to log the users' activities in your account using the Access Logs toggle button in the Settings page Audit tab. Click here to learn more on this. |
Aug 10, 2018 | |
Important Terminology ChangeWe are doing an important terminology change in Zoho Analytics today. Database renamed as Workspace Database Owner renamed as Workspace Administrators
To learn more on user roles in Zoho Analytics, refer here. Note: This is just a terminology change and will not affect any of the existing functionality. If you have any questions please write to us at support@zohoanalytics.com. |
Jul
July 5, 2018 | |
Zoho Analytics Release 4.0 Beta
We are delighted to announce the new Zoho Analytics Release 4.0 Beta. Your favorite Zoho Analytics now comes with a fresh new-look and exciting features. The new Zoho Analytics 4.0 includes the following features: Dashboards in Single Click
Easy Navigation
Geo Map Charts *
Dark Themed Dashboards *
Colored KPI Widgets *
Zoho Analytics on-premise
Those are just some of the major changes done in Release 4.0 Beta. As you use the product to visually analyze your data, you will come across a lot more features.
Not just that, more new exciting features are in development which will be rolled out as part of Release 4.0 public release. Stay tuned... To access the New Zoho Analytics 4.0, login to your Zoho Analytics account at https://analytics.zoho.com, click the Try 4.0 button at the top right. You'll get switched to the 4.0 version (This will not be enabled for trial users. You can avail this once the trial period ends). Please do give Zoho Analytics 4.0 Beta a try and let us know what you think. Post them to support@zohoanalytics.com. Looking forward to your valuable feedback.... * - Some of the features were already enabled in the existing UI. |


July 24, 2018 | |
Enhancement for Dashboard User Filters
Now User Filters in the Dashboard will be anchored as you scroll. So far the User Filters will be available in the place you have added them in the Dashboard. When you scroll down the Dashboard the User Filters will be hidden. Now they will be retained till the end of the Dashboard while scrolling. This allows you to quickly access the User Filter when required. Support to Pick Location for Geo Data
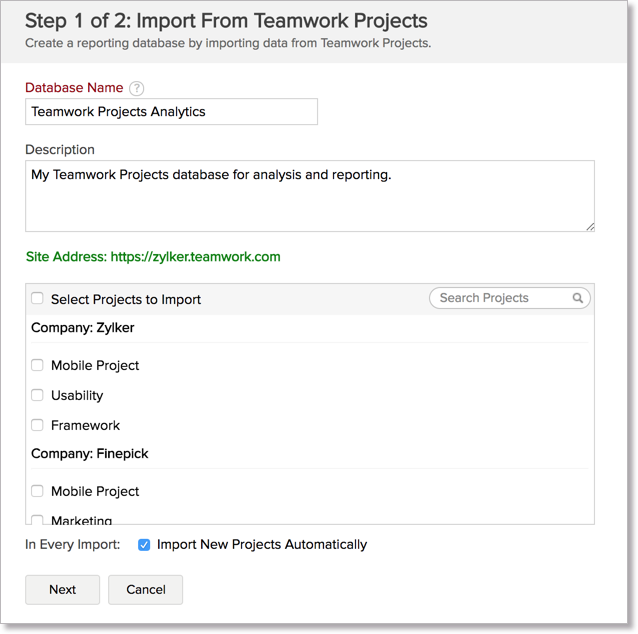
Previously you need to provide the Latitude and Longitude of the location to identify the location for Geo data. From now you can easily pick the location using in the Location Picker map. This also provides a field to search the location in the map. Click here to learn more on this. Enhancements in Teamworks Projects Advanced Analytics
Now Zoho Analytics allows you to import data from projects across Companies in Teamworks Projects into a single reporting database in Zoho Analytics. Previously, you need to create multiple databases to import data from each company. Click here for more details.
|

July 31, 2018 | |
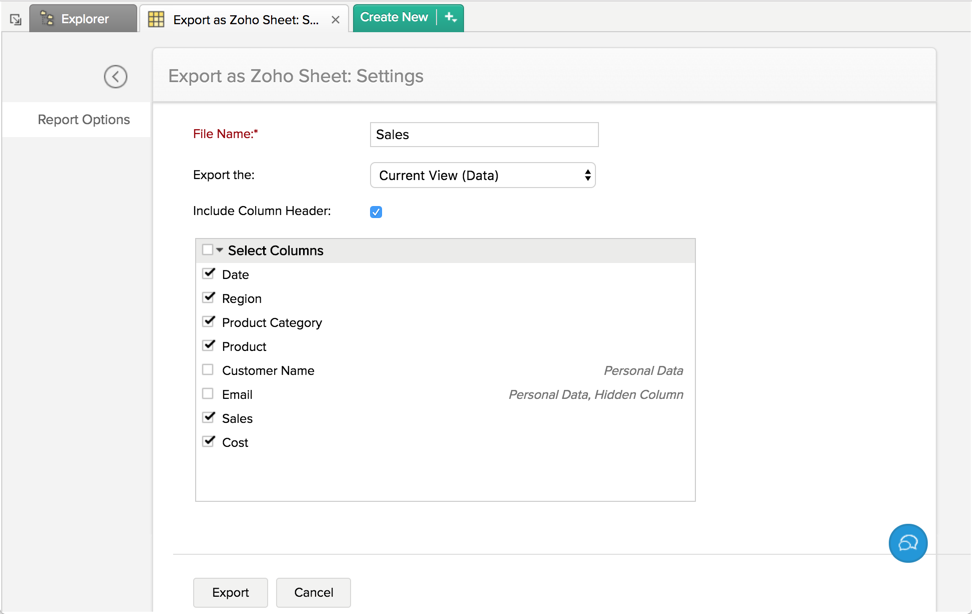
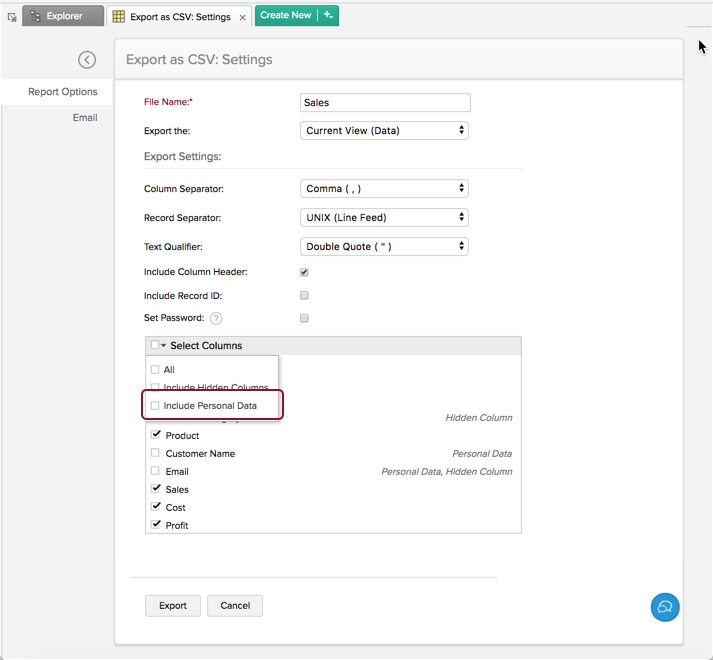
Enhancements in ExportingExporting in Zoho Analytics has been enhanced with the following options. Exporting into Zoho Sheet
Now Zoho Analytics supports exporting Tables, Query Tables, Chart, Pivot Table and Summary View into Zoho Sheet. For Chart, Pivot Table and Summary View you can either choose to export the underlying data or the summarised data of the current view into your Zoho Sheet account. Exporting Personal Data
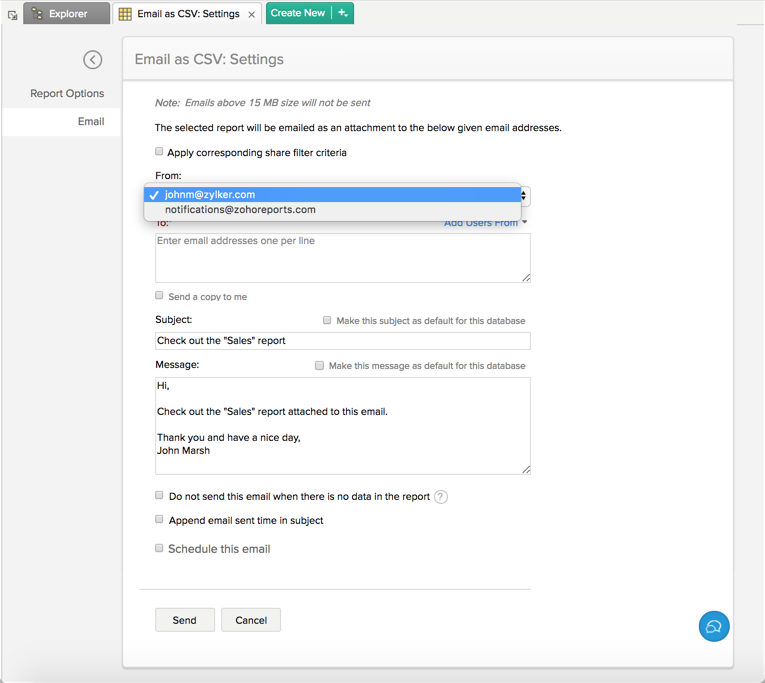
Zoho Analytics takes additional care in handling your personal data. From now on, columns marker as personal will be excluded from export by default. This avoids accidentally sharing the personal data with others. However, you can choose to export them by explicitly selecting them. Emailing Reports - Configurable From Address to handle DMARC
Until now, the reports that you mail from Zoho Analytics will be sent to the specified users from your email address. In case your receiver has set up DMARC for mail sender validation, then these emails might be blocked or sent to spam. To avoid this, you can choose to mail the reports directly from Zoho Analytics common mail address (notifications@zohoanalytics.com). You can select this in the From field on Email Setting page. |
Jun
June 7, 2018 | |
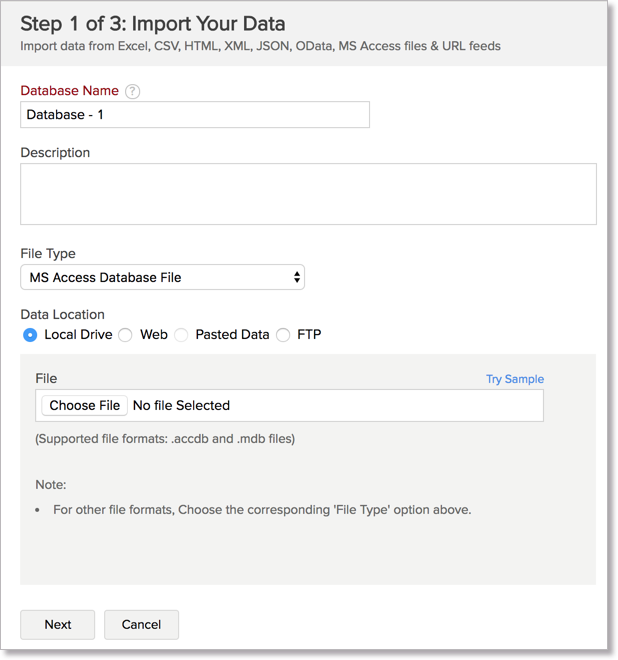
Importing from MS Access Database using Import Wizard
Now you can import data from the MS Access database files you have stored in Local Drives, Web URLs, FTP servers or Cloud Drives right from the Import Wizard in Zoho Analytics user interface. Previously MS Access database files can be imported only using the Upload Tool. You can choose a Single table, Multiple tables or write a custom SQL query to fetch the data for importing. You can schedule the import in periodic intervals if the Access database files are stored in a Web URL or FTP server or Cloud Drives. You can also choose to sync data instantly from your database in a few clicks. To learn how to import data from MS Access database files, refer here. Importing from Secured Web URL with OAuth authentication
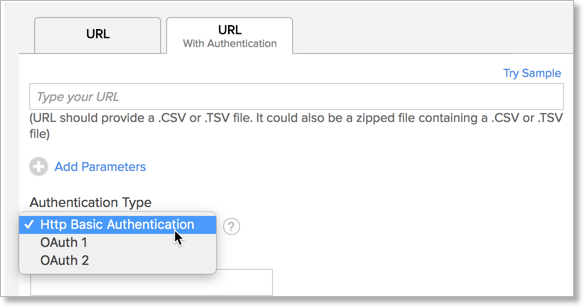
So far you can import data from authenticated Web URLs which supports only basic authentication system. Now, this has been enhanced to support import data from Web URLs using OAuth 1 and OAuth 2 authentication system. Click here to learn more on this. Supporting Dynamic Parameter in Web URL Import
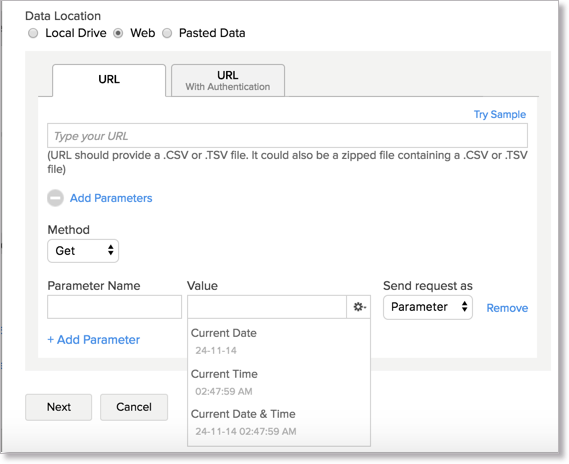
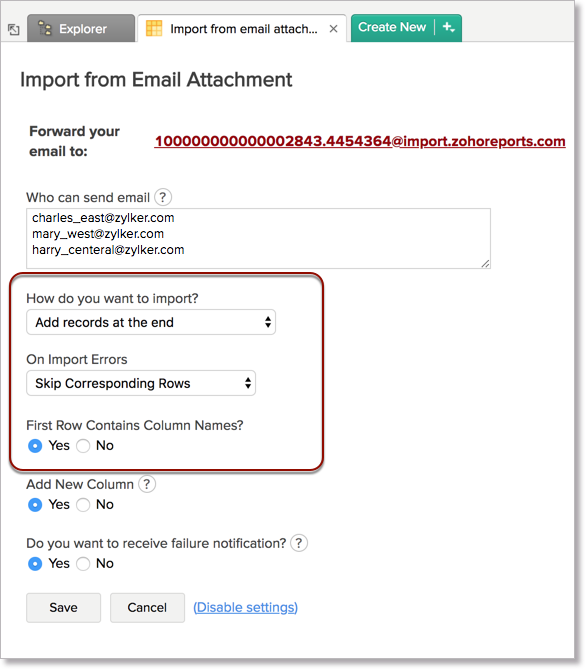
With this update, you can set dynamic values for the parameter while importing data from Web URLs. You can specify Current Date, Current Time and Current Date & Time as a dynamic value for the parameter of the import URL. Learn how to set dynamic value for import parameter from here. New Options in Importing from Email Attachment
Zoho Analytics now provides the following new options for Importing from Email attachment:
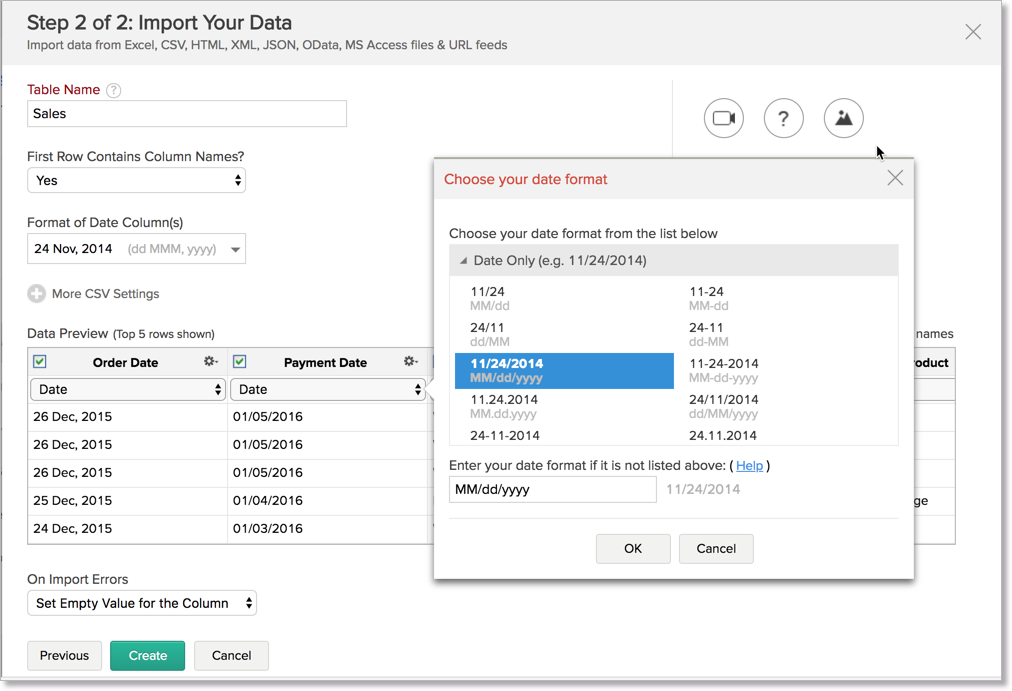
Learn more on these options from here. Multi-date Format Support in Imports
Now Zoho Analytics supports importing data with multiple date formats. Previously, when your data has date columns in different date format, then the column with the first date format alone will be identified as a date while importing. The rest of the columns will be imported as text columns. Now Zoho Analytics will identify multiple date columns with their corresponding date formats. You can also choose to modify the identified date format for each column using the Change Date Format option in preview menu. To learn how to configure multiple date format while importing, refer here. |
June 12, 2018 | |
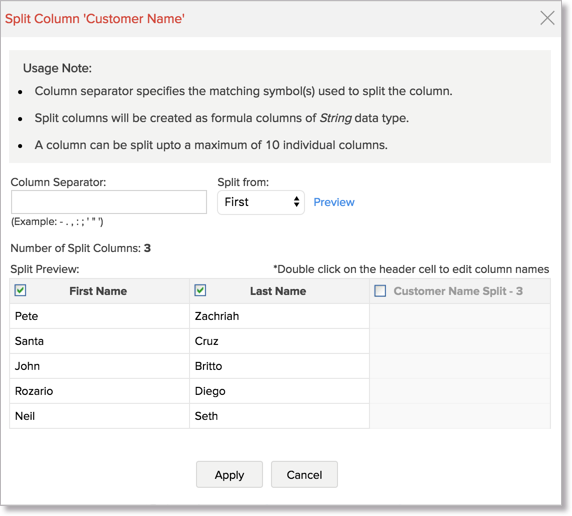
Split Column Option for Data Preparation
Do you have a concatenated values in your columns which you want to split for making better sense of your data and analytics? A simple example is splitting a customer name column as a first name and last name. The new Split Column option helps you do this exactly. The Split Column option allows you to split the value in a column into multiple columns based on a separator. This can be applied over the columns with data type Text, Multi-line Text, Email and URL. The split columns will be created as Formula columns with string data type. To learn how to split a column refer here. |
May
May 16, 2018
Geo Maps for Zoho Analytics (Beta)
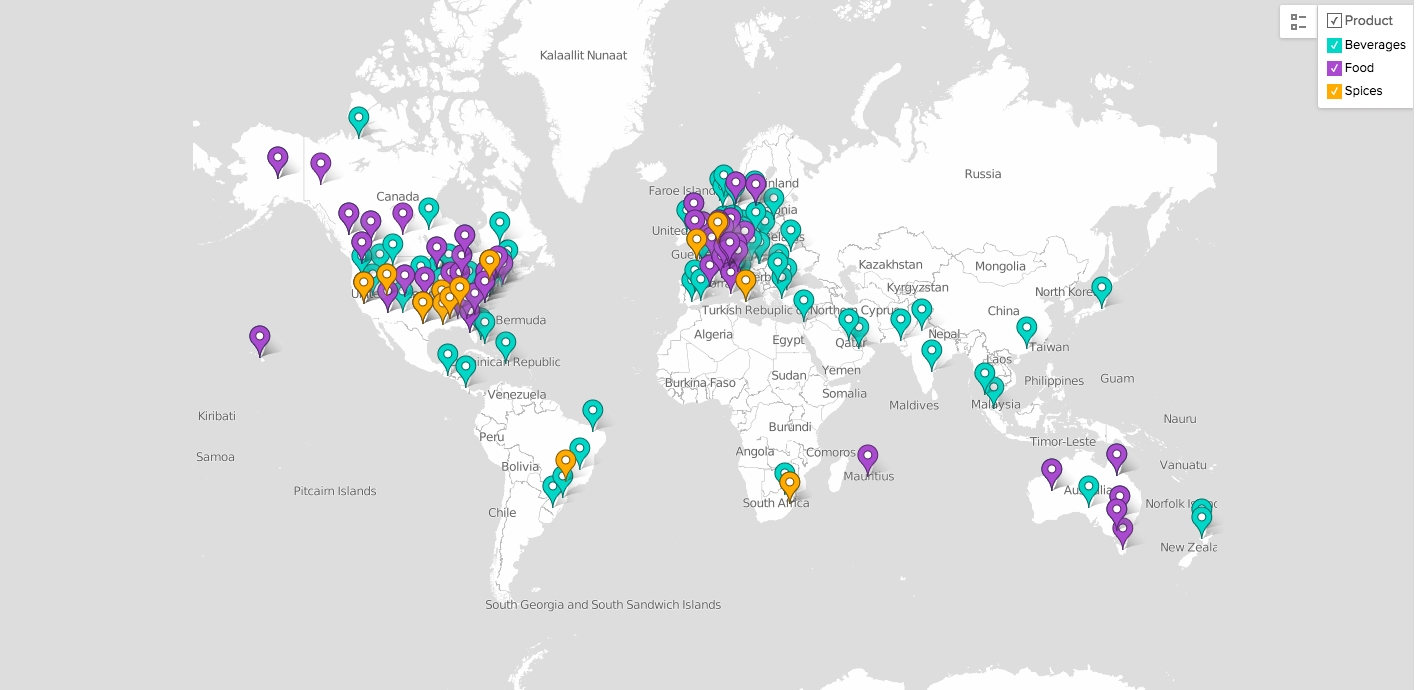
Zoho Analytics users can now visualize their geographical data using a new chart called Map Chart (also called as Geo Maps). A map chart is a map of a world, continent, or country, with the data values assigned to specific regions through chart visualizations.
At present Zoho Analytics supports 5 types of Geo map types - Map scatter, Map bubble, Map pie, Map bubble pie and Map filled. These map charts will help you in analyzing your geospatial data using cool and interactive chart visualizations. You can easily create a map chart by dragging and dropping the Geographical columns in the X or Y axis of the chart designer.
Note
This feature is currently in public beta testing. Therefore you may encounter certain functional bugs and limitations. We request you to try it out and share your valuable feedback to support@zohoanalytics.com.
Teamwork Desk Advanced Analytics
We at Zoho Analytics are happy to announce the general availability of Teamwork Desk Advanced Analytics. Zoho Analytics advanced analytics for Teamwork Desk enables you to easily analyze your helpdesk data in Teamwork Desk. With this, you can easily slice and dice your helpdesk data, derive key metrics and transform them into actionable insights with the power of analytics.
The integration comes with 75+ reports and dashboards organized functionally as Teamwork Desk overview, agent performance, traffic insights, customer analytics, satisfaction, users, and much more.
Learn More: Teamwork Desk Advanced Analytics | Sample Reporting Gallery
May 28, 2018 | |
GDPR ComplianceIn compliance with the General Data Protection Regulation (GDPR) effective from May 25, 2018, we have made the following enhancement in Zoho Analytics.
Follow the below links to know more
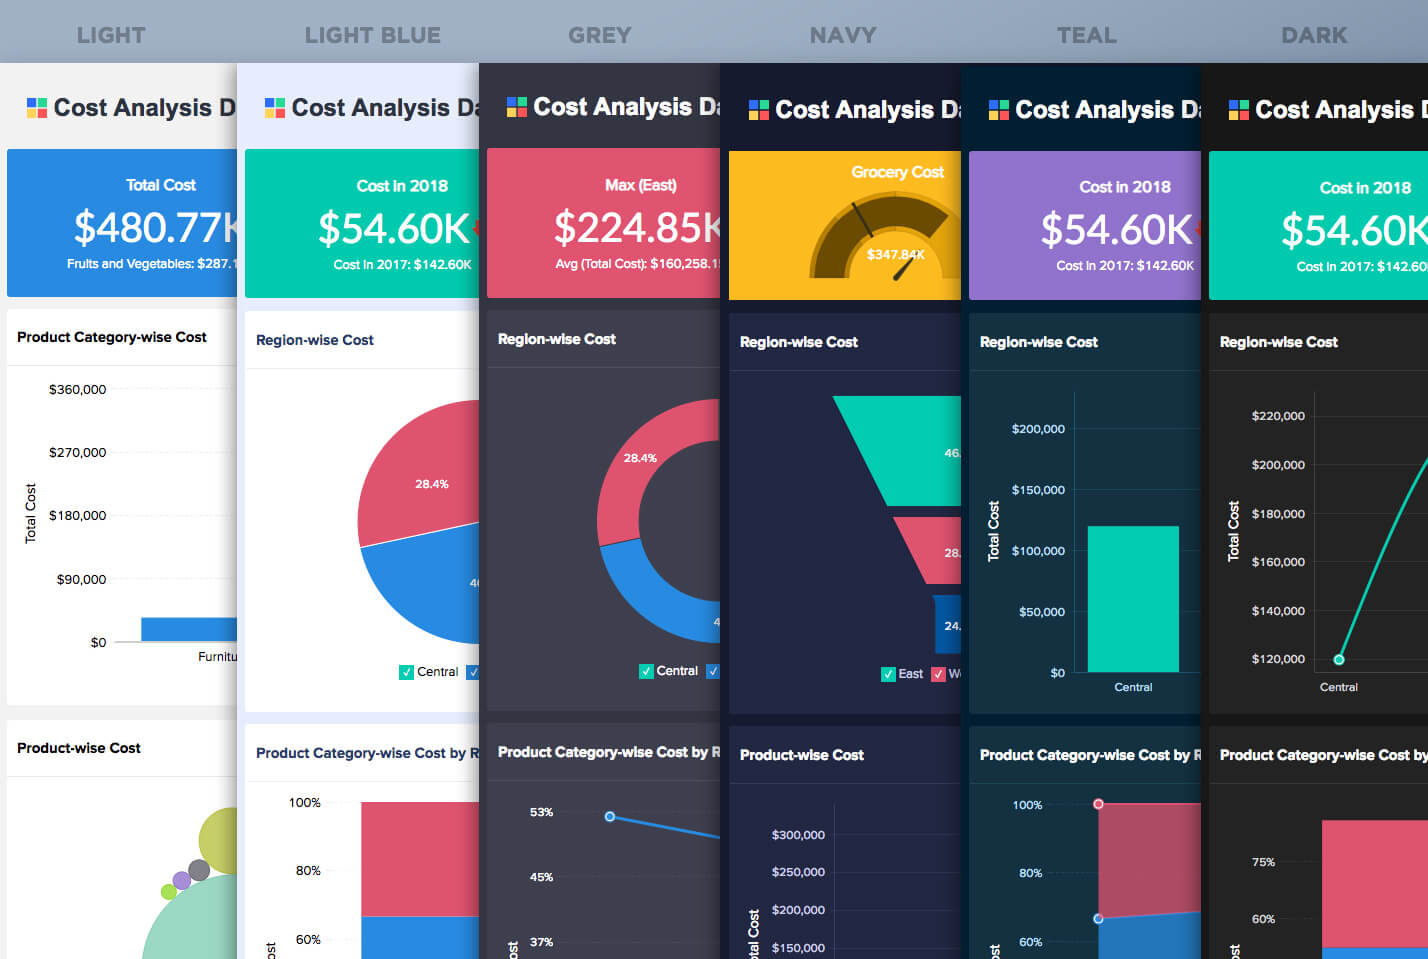
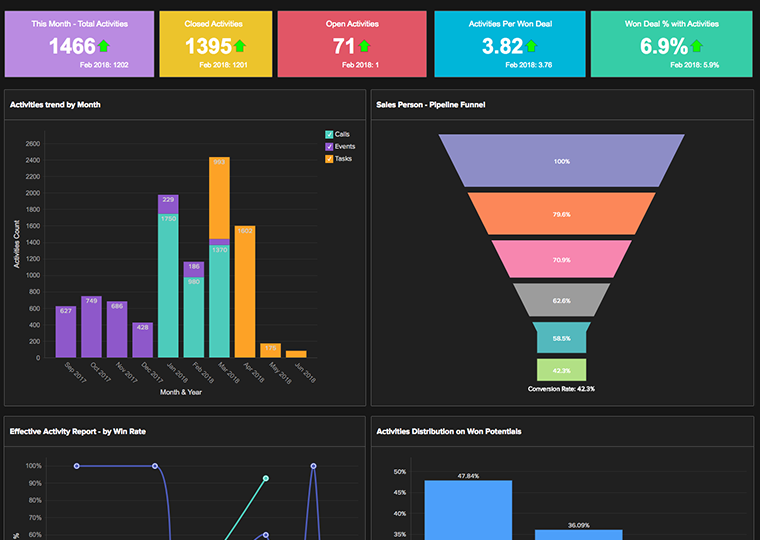
New Enhancements in DashboardsDark Themes:
We are excited to introduce 6 Dark themes that will enhance the look and feel of your dashboards. Not just visual appeal, these themes have been designed to increase usability and break monotony on repeated access. You can customize all the elements in the dashboard theme right from background color to picking report colors specific to the dashboard. This enables you to design a theme that not only captures your organization's branding but also add a character/theme to your reports. These dark themed layouts are in addition to the existing 6 light themed dashboards. You can quickly check out the theme types using the radio button in the Dashboard Themes dialog.
KPI Widget Themes:From now on, you can apply themes/background colors for both single numbered and chart type widgets. This new feature further enhance the appearance of widgets in dashboard.
Secure your Private URLs and Exported Files with PasswordIn this update, we have introduced password protection for exported files and privately embedded views or URLs for enhanced Data security on export and private URLs. Password Protection for Exported FilesYou can choose to protect the exported data from unauthorized access using password protection.
Password protection for Privately Embedded Views and URLsYou can protect your private URLs (without Login) with password. This way you will be able to restrict the access only through password.
|

Apr
April 10, 2018
New Formatting options for Charts and KPI Widgets:
Zoho Analytics now provides flexible formatting options to format all the elements in charts and KPI Widgets.
Charts:
You can now format all the data elements used in creating a chart. Earlier, Zoho Analytics allowed you to only format the columns dropped in Y-axis shelf. With this new update, you can customize the formatting for all the columns that are used in creating the report. Watch the below video to learn how.
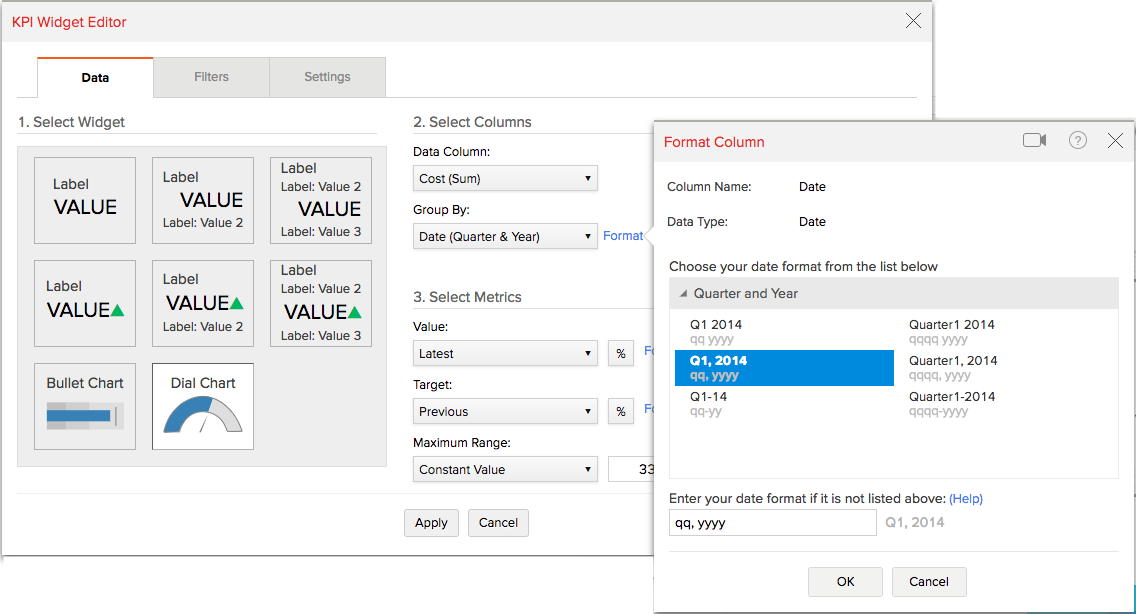
KPI Widgets:
We have added an option to format the 'Group by' column used in creating a KPI widget. With this update, Zoho Analytics allows you to format all the components of a KPI Widget.
New options in Advanced Summary Functions
The widely used Advanced Summary functions in Pivots has become even more powerful with the new set of functions.
Following are the new options that are provided in the Advanced Summary Function:
- Running Total - Until now when you select a Running Total function, you can only compute Sum. From now on you can apply functions like Average, Minimum and Maximum in addition to Sum.
- Difference From - Displays the data value as the difference from the value in the previous cell, based on the base field provided. You can choose to compare the difference from either of Previous Value, Next Value, First Value or Last Value. Previous Value will be selected by default.
- % of Difference From - Displays each data value as a percentage of difference from the previous value (or the specified value). You can choose to compare the % difference from either of Previous Value, Next Value, First Value or Last Value. Previous Value will be selected by default.
Mar
March 13, 2018
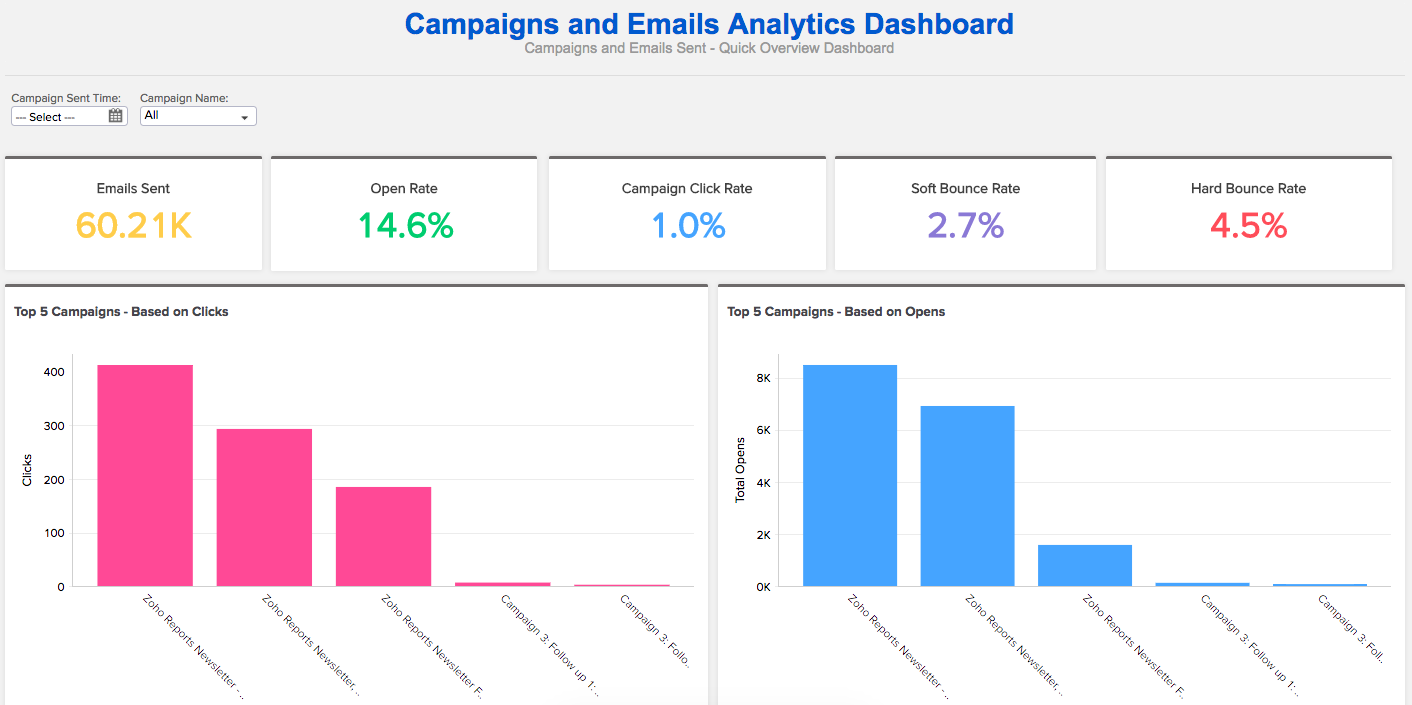
Zoho Campaigns Advanced Analytics
We at Zoho Analytics are very happy to announce the release of Zoho Campaigns Advanced Analytics connector. Zoho Campaigns advanced analytics integration powered by Zoho Analytics enables you to easily analyze your email campaigns and derive great insights.
Product marketers and analysts can slice and dice their campaign data and derive key campaign metrics such as campaigns trend, conversion rate, click rate, open rate, unsubscription trend and do much more.
Zoho Analytics also enables you to blend your campaign data with a variety of data sources and popular business applications such Zoho CRM, Salesforce, Dynamics CRM etc to perform cross-functional analytics.
The connector comes with 50+ hand-picked reports and dashboards organized functionally as campaign & email analytics, email domain analytics, subscriber analytics and list analytics, thus enabling you to easily jumpstart on your analysis.
Learn more:
March 27, 2018
New and Improved Google Analytics Integration
We at Zoho Analytics are happy to announce the new version of Google Analytics advanced reporting connector. This new and improved integration allows you to seamlessly import your website data from Google Analytics into Zoho Analytics. It also allows you to create and import custom modules (modules that are created by combining data from selective dimensions and metrics). That apart, we have extended support to data import from E-commerce and Site speed modules.
These improvements will help marketers slice and dice their site's data, analyze key metrics, and make informed decisions in optimizing SEO/SEM campaigns. The new version comes with a refreshed set of pre-built reports and dashboards that will help you jumpstart your analysis.
Note
Henceforth this integration is available only in the paid plans of Zoho Analytics. Users who have set up this integration from a free plan prior to this release can continue to use their existing integration for free. But, if they wish to set up a new integration they will have to upgrade to any of the paid plans.
Learn more about this integration.
Import from Email Attachment
Zoho Analytics now enables you to import data into an existing table from an email attachment. This allows data to be automatically uploaded into a table by just sending an email to a specified email id as an attachment.
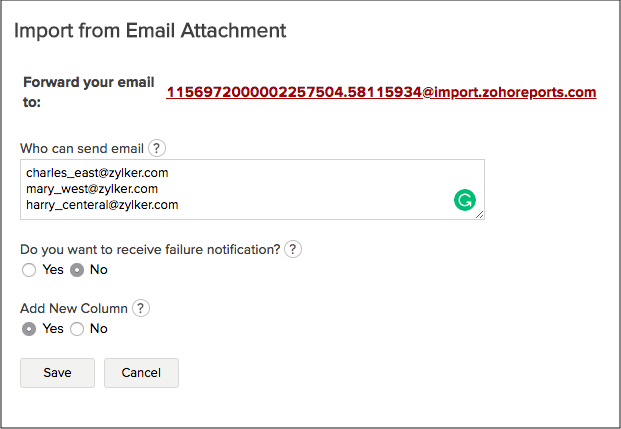
This option is available only for Premium and Enterprise plan users.
Support for 'User' module in Zoho Finance apps
Zoho Analytics now supports User module in Zoho Finance apps. From now on, you can import the data from User module either at the time of the setup or by editing the setup.
Feb
Feb 22, 2018
SurveyGizmo Advanced Analytics

We at Zoho Analytics are happy to announce the availability of the SurveyGizmo Advanced Analytics integration. This enables you as an analyst to proactively manage, measure and derive analytical insights from your surveys.
Using this connector you can easily slice and dice your survey responses, derive key metrics and transform them into actionable insights with the power of analytics.
The SurveyGizmo Advanced Analytics comes with a unique set of hand-picked reports and dashboards that enables you to easily jumpstart your analytics.
Jan
Jan 04, 2018
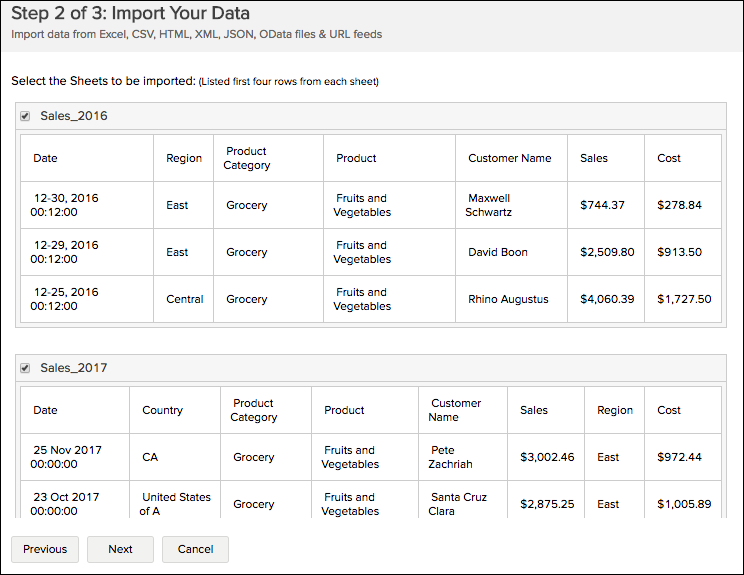
Import Data from Multiple Excel Sheets in a Single Click
Zoho Analytics now allows you to import all the data from your Excel workbook in one go. Earlier, users were allowed to select only one sheet at a time while importing data from an Excel workbook.
From now on, when importing an Excel workbook, you can select multiple sheets at a time to be imported into Zoho Analytics (in Step 2 of the Import Wizard). Each sheet will be stored as an individual table in the Workspace.
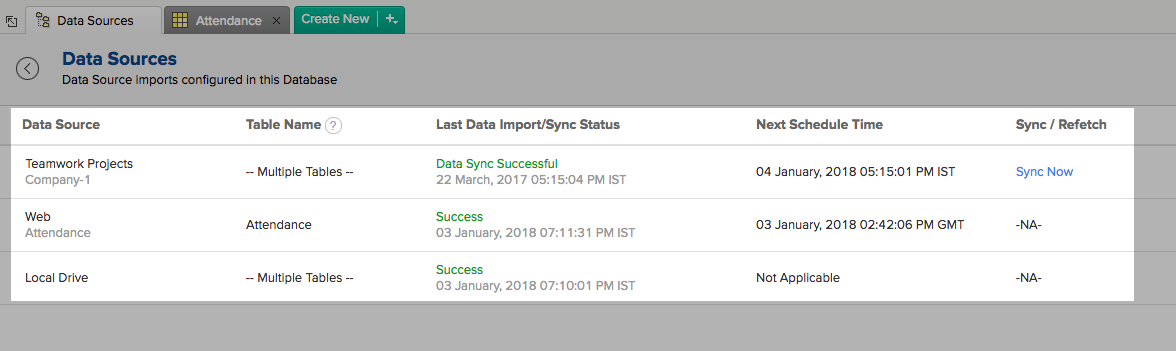
Unified Data Sources page to manage all your Data Imports
Zoho Analytics has enhanced the Data Sources page to easily view and manage all the import data sources setup in a Workspace. Earlier this feature listed only the advanced analytics connectors in the Workspace. From now on this page will contain details of all the Import Sources in the Workspace.
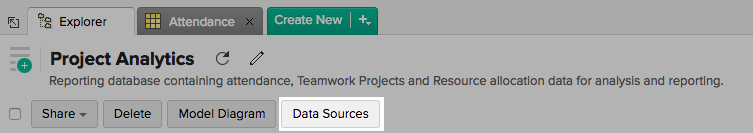
You can access this page by clicking the Data Sources button in the Explorer tab of the Workspace.
You can view and manage the data sources from this page by selecting them.
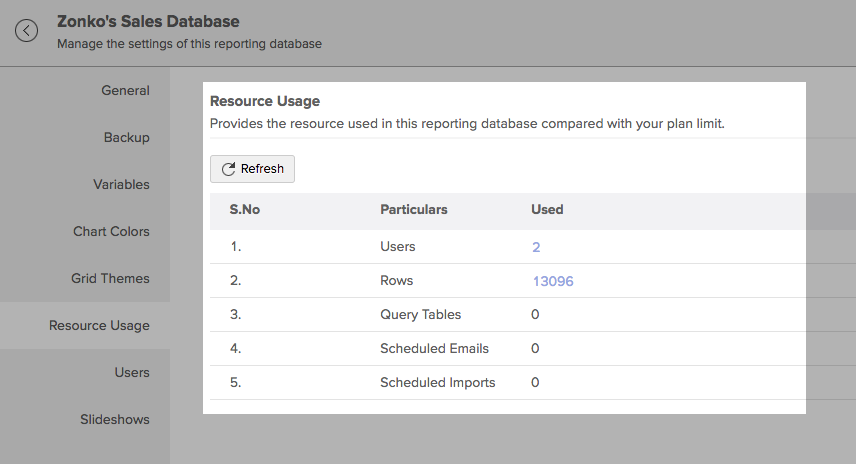
Track Resource Usage and Manage Users of a Workspace
Zoho Analytics allows you to keep a track of the resources that are used at the database level. This feature enables you to monitor and manage the resources used for that particular Workspace.
You can view these details by clicking Settings > Resource Usage.
You can perform operations such as adding, deleting and deactivating a user from the Workspace. Click the Users tab to perform these operations.
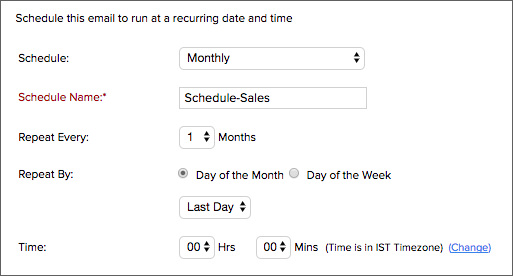
Option to Schedule Email on the Last Day of the Month
With this update, you can set schedules to email reports on the last day of the month. Earlier if you had to email a report on the last day of the month, you will either have to select 30 or 31.
Now, you can select the option Last day under the Repeat By section. This will automatically send emails on the last day of the month.
Jan 17, 2018
HubSpot CRM Advanced Analytics
We are happy to announce the general availability of HubSpot CRM Advanced Analytics powered by Zoho Analytics. This integration empowers you with deep sales analytical capabilities and helps you keep track of your Key Sales Performance metrics.
HubSpot CRM Advanced Analytics comes with over 60+ handpicked sales analytics reports and dashboards that you will find of great value. You can also create your own insightful reports to track your sales pipeline, visualize your sales conversion funnels, measure sales team performance, forecast your sales and do much more with ease.
Learn more
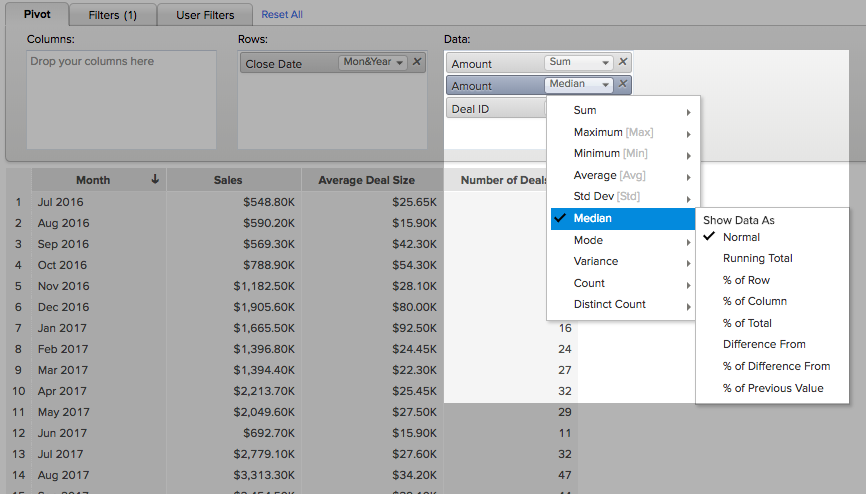
Support for Median and Mode Function
You can now apply Median and Mode function over your columns while creating reports.
To apply this,
- Drag and drop the column into the reports designer
- Select Median or Mode function from the drop down as shown in the snapshot
2017
Dec
Dec 5, 2017
Zoho Survey and SurveyMonkey Advanced Analytics
We at Zoho Analytics are happy to announce the availability of the Zoho Survey and SurveyMonkey Advanced Analytics integrations.
These integrations enable you as an analyst to proactively manage, measure and derive analytical insights from your surveys run in Zoho Survey or SurveyMonkey. With Zoho Analytics you can easily slice and dice your survey responses, derive key metrics and transform them into actionable insights with the power of analytics.
These connectors come with a unique set of hand-picked reports and dashboards that enables you to easily jumpstart your analytics.
Zoho Survey Advanced Analytics
SurveyMonkey Advanced Analytics
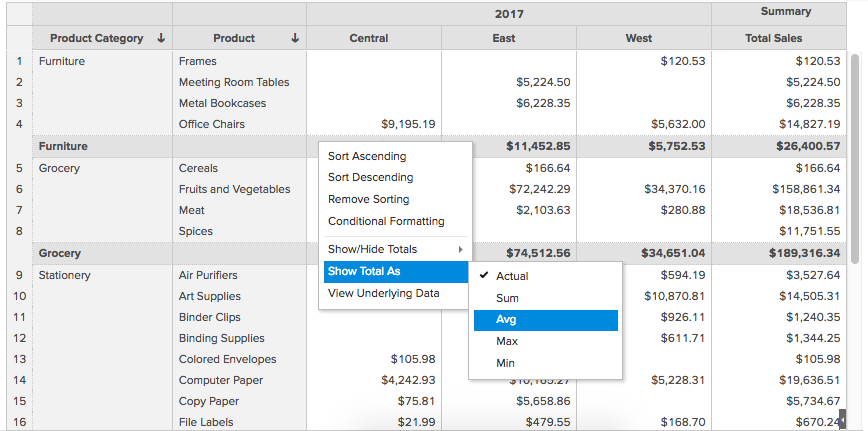
Show Total As
In Pivot Tables, by default, the summary function used to display the subtotals will be the same as that of the summary function applied on the corresponding data column. With this update you can customize this and apply any other summary functions such as sum, average, min and max on the sub-total and grand total that is displayed.
Nov
Nov 7, 2017
Teamwork Projects Advanced Analytics
We at Zoho Analytics are happy to announce the general availability of Teamwork Projects Advanced Analytics integration. This connector empowers project managers with advanced analytical capabilities thereby giving a greater visibility & control on their project execution.
Users of this application can slice and dice their project data, derive & analyze key project metrics such as project completion rate, resource utilization rate, risk rate and do much more. The connector comes with 50+ hand-picked reports and dashboards organized functionally as Overview, Members/Users, Milestones, Tasks, Risks, and Time-tracking, thus enabling you to easily jumpstart on your analysis.
Read more about the Teamwork Projects - Zoho Analytics integration
Click to learn about:
Nov 29, 2017
Public Announcement: Google AdWords Advanced Analytics
We at Zoho Analytics are happy to announce the general availability of Google AdWords Advanced Analytics integration. This connector provides deeper marketing analytical capabilities for your campaign data in Google AdWords.
Product marketers and SEM analysts can 'slice & dice' their AdWords campaigns data in depth and analyze key performance metrics such as impressions, click rate, conversion rate, cost metrics, growth rate and much more. Not just that, users can blend their marketing data in Google AdWords along with other related data sources such as CRM and perform cross-functional analytics
The connector comes with 80+ handpicked default reports and dashboards organized functionally as Accounts overview, Ad group Performance, Ad Performance, Campaigns Performance and Geo Performance.
Click to learn about:
Oct
Oct 4, 2017
Beta: Zoho Campaigns Advanced Analytics
We at Zoho Analytics are very happy to announce the Beta release of Zoho Campaigns Advanced Analytics connector. The Zoho Campaigns advanced analytics integration powered by Zoho Analytics enables you to easily analyze your email campaigns and derive great insights.
Product marketers and analysts can slice and dice their campaign data and derive key campaign metrics such as campaigns trend, conversion rate, click rate, open rate, unsubscription trend and do much more.
The connector comes with 50+ hand-picked reports and dashboards organized functionally as campaign & email analytics, email domain analytics, subscriber analytics and list analytics, thus enabling you to easily jumpstart on your analysis.
Learn more:
- The Zoho Campaigns Advanced Analytics is currently in public beta testing. Therefore, you may encounter certain functional bugs and limitations.
- This connector is available for testing for all the users in the paid plan.
- If you are a free plan user and wish to evaluate this integration, write to us at support@zohoanalytics.com
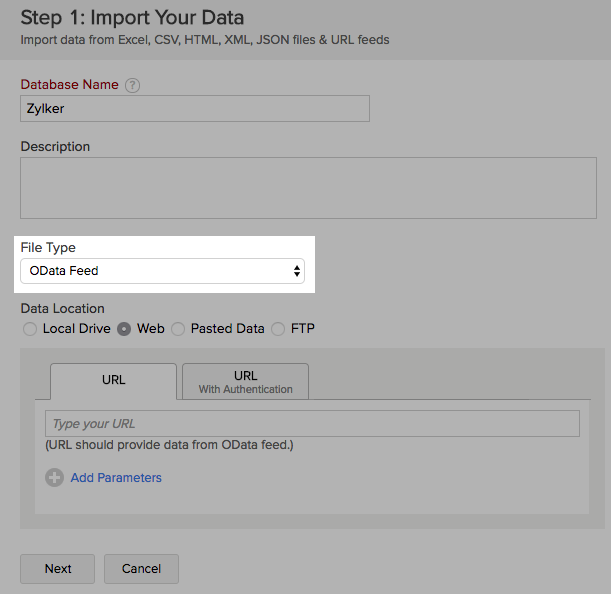
Support for Importing OData feeds
Zoho Analytics now extends support to import data from OData feeds. Users can import their data into Zoho Analytics by providing the URL of their OData feed.
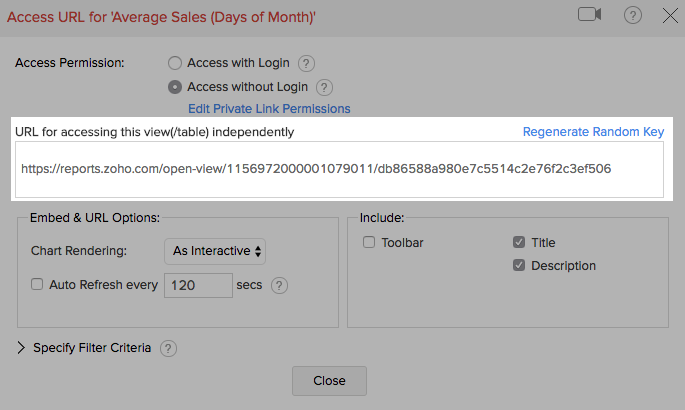
Shortened Embed/Permalink URL
The Embed/Permalink URL generated for reports and dashboards using the Publishing option has been shortened such that you can easily share them across channels.
Please do note that the previously generated URL's will continue to work without any glitches.
Oct 12, 2017
Introducing Dynamic Threshold feature for Charts
We at Zoho Analytics are happy to announce the Dynamic Threshold feature. Until now, users could only set a static (constant) value as threshold. With this update, users can apply dynamic functions (value) such as Sum, Avg, Minimum, Maximum over the column in the reference axis or over a different column.
Users can now set the Scope of the threshold to the entire chart or set the threshold value for each data point (cell).
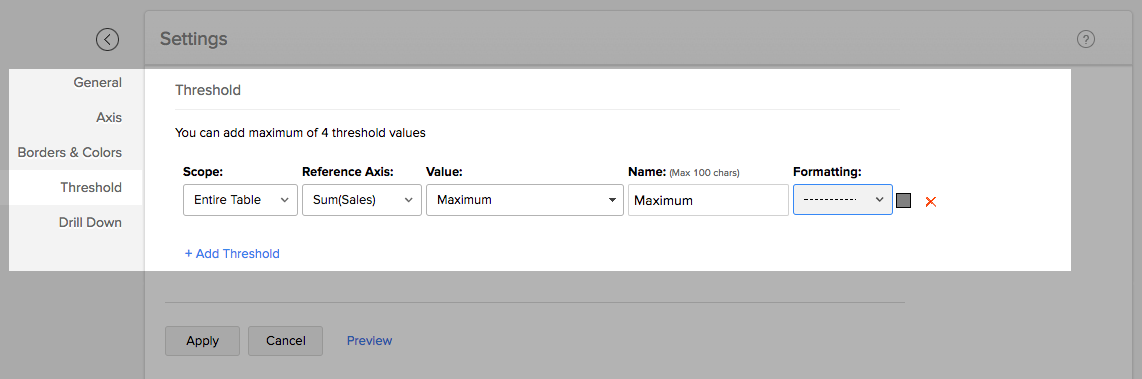
Apart from this, we have also added a new threshold line styles under the formatting option.
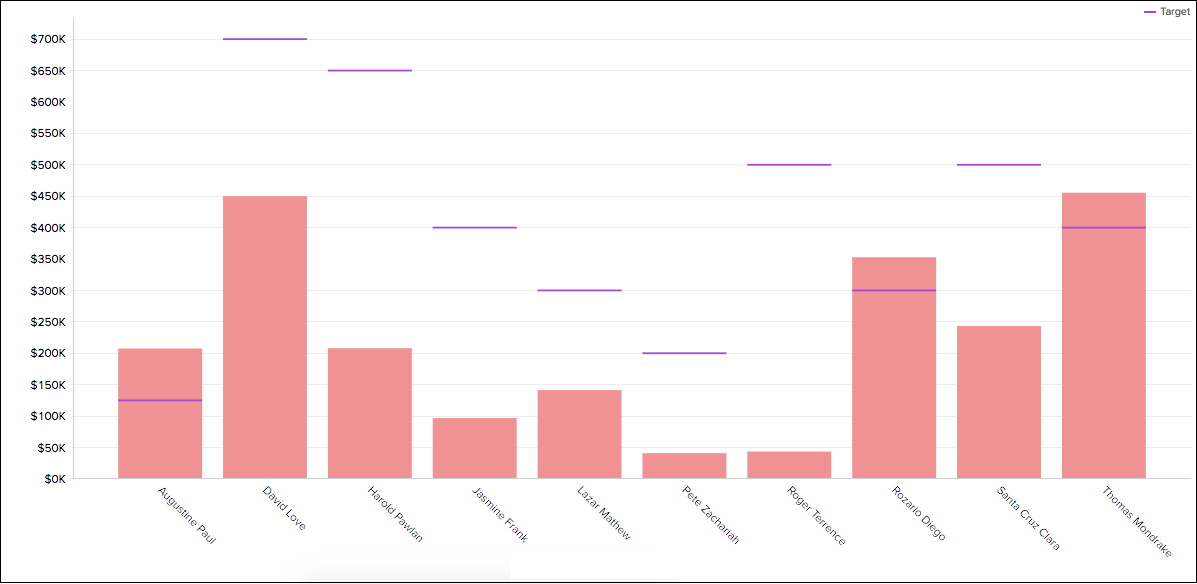
Applying Grid Themes at Database level
Recently, we released the Grid themes feature which allows you to customize the look and feel of your Pivot, Summary and Tabular views. This feature enables you to apply colorful and attractive themes over your grid-based views.
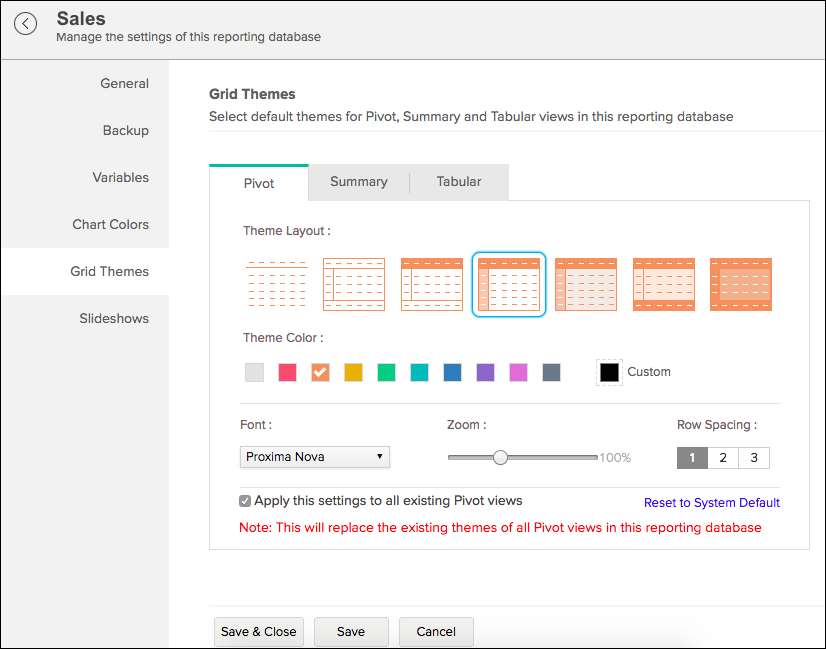
To set Grid Themes:
- Open the corresponding reporting database.
- Click the Settings option at the top right corner.
- In the Database Settings tab that opens, click Grid Themes.
Changes in the User Filters interface
We have completely changed the User Interface of the User Filters dialog to enhance the experience. The New UI will allow you to quickly apply the necessary customizations.

Oct 31, 2017
Stripe Subscriptions Advanced Analytics

We at Zoho Analytics are happy to announce the availability of Stripe Subscriptions Advanced Analytics integration. This connector enables you as a business owner to proactively manage and drive your subscription business with deep analytical insights.
With Stripe Subscriptions Advanced Analytics you can slice and dice your subscription data, derive & analyze key SAAS subscription metrics such as revenue, growth rate, churn rate, cancellation rate, customer growth rate and do much more. The connector comes with 75+ hand-picked reports and dashboards organized functionally as Subscription, Churn Analytics, Revenue, and Customer Analytics thus enabling you to easily jumpstart on your analysis.
Click to learn about,
New Edition and Modules Support in QuickBooks Analytics
With this update we have made the following enhancements to Advanced Analytics for QuickBooks Online:
- Support for data import from QuickBooks Online US, UK, IN, CA and AU editions.
- Support for modules such as Tax (Tax Code, Tax Agency, Tax Rate), Budgets and Time Activity
Sep
Sep 7, 2017
Public Release: Microsoft Dynamics CRM Advanced Analytics
We at Zoho Analytics are extremely excited to announce the public release of the Microsoft Dynamics CRM Advanced Analytics connector. This integration empowers you with deep sales analytic capabilities over your data in Microsoft Dynamics CRM. Thereby enabling you to keep track of your Key Sales Performance metrics and optimize your sales execution.
It comes with over 100+ handpicked reports and dashboards that you will find of great value. You can also create your own insightful reports to track your sales pipeline, measure sales team performance, forecast your sales and do much more with ease.
To explore further, please refer to the below links:
Sep 27, 2017
Analytics on the Go: Introducing New Mobile Apps for iPhone and Android phones
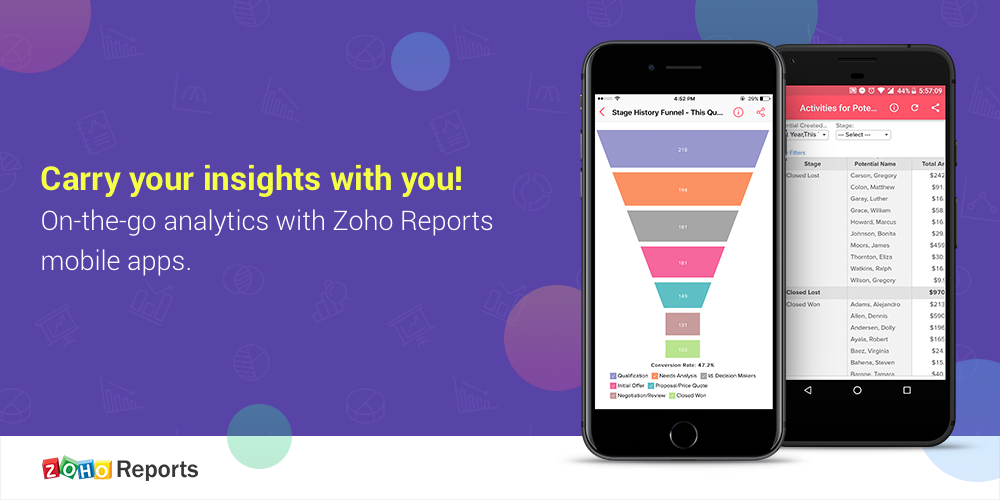
We at Zoho Analytics are extremely happy to announce the availability of Zoho Analytics Mobile Apps for both iPhone and Android phones. This is in addition to the already existing apps for iPad and Android tablets.
With the Zoho Analytics Mobile BI app, you can access the reports and dashboards that you create in Zoho Analytics service, on the go.
The Zoho Analytics Mobile BI application provides you with the following capabilities:
Interactive Analytics: Interact and explore reports through an immersive touch experience through actions like drill down, user filters, view underlying data and much more.
Analytics on the go: Analyze the reports and dashboards, keep track of key metrics anytime anywhere from your mobile application.
Easy Access: Easily access and traverse across your reports through visual previews, powerful search and a variety of view categorization options.
Collaborative Analytics: Collaborate with your colleagues by sharing reports and dashboards with fine-grained access control.
You can download the app for free from the Google Play store and the App Store.
![]()
![]()
Do try it out and share your valuable feedback. Click to learn more.
Aug
Aug 22, 2017 | |
Zoho Desk Advanced Analytics
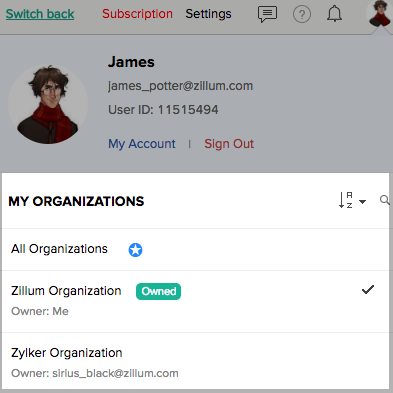
We at Zoho Analytics are happy to announce the general availability of Zoho Desk Advanced Analytics integration. This connector enables Zoho Desk users to easily analyze their help desk data and track their key help desk metrics. The Zoho Desk Advanced Analytics connector comes bundled with over 75+ domain specific default reports & dashboards such as agents' performance, customer analytics, deadline complience, satisfaction rating, and much more. You can also create your own insightful reports & dashboards for in depth analysis. Not just that, if you are a user of Zoho CRM and Zoho Desk, you can combine data from both the domains for cross functional reporting and analysis. Click here to view a sample dashboard created by blending data from Zoho CRM and Zoho Desk. Click to learn more about Zoho Desk Advanced Analytics. Zoho Analytics moves from User based Model to Organization ModelZoho Analytics now allows you to manage your account and collaborate with your colleagues and users with a segregated workspace called Organization. The administrator of the organization is allowed to control the permissions, add/delete the users in his organization and manage the subscription of his organization account.
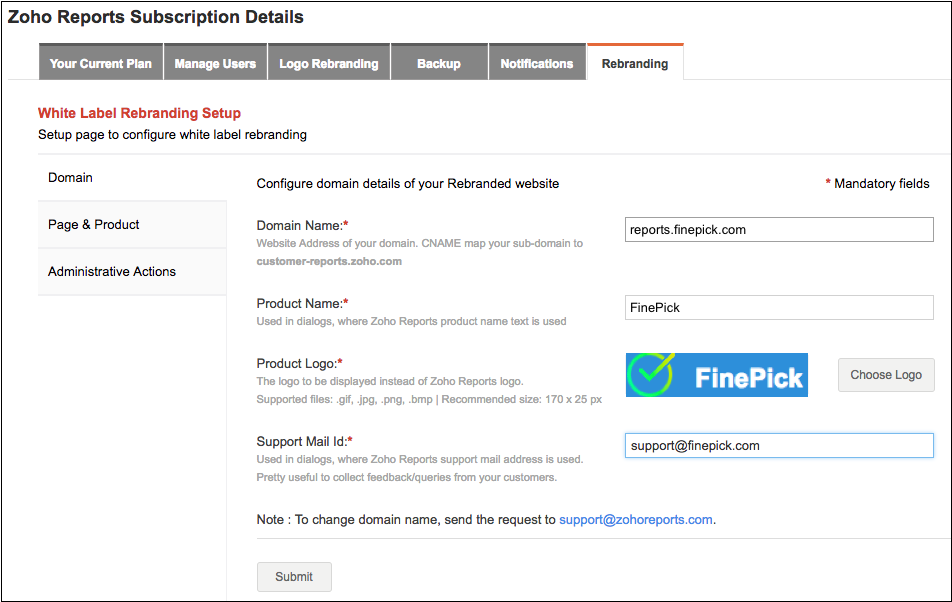
Until now Zoho Analytics has been following a User Based Model where each user will be allocated an individual workspace. From now on, the members of an organization can collaborate and use a shared workspace. Click to learn more about organizations. Powerful Admin Console interface for Zoho Analytics White Label UsersAs you might now, Zoho Analytics offers a powerful Embedded Analytics and White Label Solution for independent software vendors, solution developers, consultants etc., to quickly implement a ready-made BI and analytics solution into their product/service offering. White Label users can now manage their White Label settings through a powerful administrative console from within Zoho Analytics. To access the admin console,
Note The White Label solution of Zoho Analytics is not available for all users by default. It is available to customers only on request. If you are interested in using Zoho Analytics as your White Label Solution or Embedded Analytics Service, write to us at support@zohoanalytics.com |
Aug 30, 2017
Zoho Creator Advanced Analytics
We at Zoho Analytics are extremely thrilled to announce the general availability of the much awaited Zoho Creator Advanced Analytics Integration.
Zoho Analytics Advanced Analytics Add-on for Zoho Creator enables you to easily slice & dice your application data and create insightful reports & dashboards. Users can embed reports and dashboards within your Zoho Creator apps.
Empower your creator applications with deeper analytical capabilities from Zoho Analytics. This integration is available in all the paid plans of Zoho Analytics.
New Modules Support in Xero, Zoho Finance, and ServiceDesk Plus Advanced Analytics connector applications
With this update, we extend to support the following modules in Xero, Zoho Finance applications, and ManageEngine ServiceDesk Plus.
Xero Advanced Analytics
- Journals Cash Basis (in both Accrual and Cash Basis)
- Repeating Invoices and Repeating Bills
- Purchase Orders and Line Items
- Tax Rates
- Overall Budget
Click to view the complete list of modules.
Zoho Finance Advanced Analytics (for Zoho Books and Zoho Invoice apps)
- Vendor Addresses (Zoho Books)
- Customer Addresses (Zoho Books and Zoho Invoice)
- Purchase Receive (Zoho Books)
Click to view the complete list of modules.
ManageEngine ServiceDesk Plus on Premise
- Change Management Module. (Supported from Version 9317)
Jul
Jun
June 1, 2017 | |
Announcing New Charts Visualizations. #MoreVariety - #MoreColors - #MoreImmersive - #MoreModern We at Zoho Analytics are extremely happy to announce the general availability of the brand new version of our charts visualizations. Our new charts brings in more variety, more pleasing & cool color schemes, offers more immersive experience and is built on a more modern technology stack. #MoreVariety: We have now added several new chart types such as Bubble, Packed Bubble, Dial and Bullet to our library, making it more than 30+ charts visualizations to pick from... #MoreColors: Pickup from a wide range of color palettes and customize your charts & pivots to make them look cool & trendy. You can also create your own custom palettes. #MoreImmersive: Indulge into an immersive & exploratory experience with dynamic drill-downs, sleek filters, faster loading, pleasing animations and much more... #MoreModern: New chart visualizations have been built ground-up using the latest web technologies such as HTML 5, Javascript, CSS & SVG making it cooler, faster and lighter. You can also read more on this announcement in our latest blog post. Try the new charts visualizations and let us know what you think about it. We would love to hear your feedback. Also, help us spread the word by tweeting with #VisualizeMore. |

May
May 17, 2017
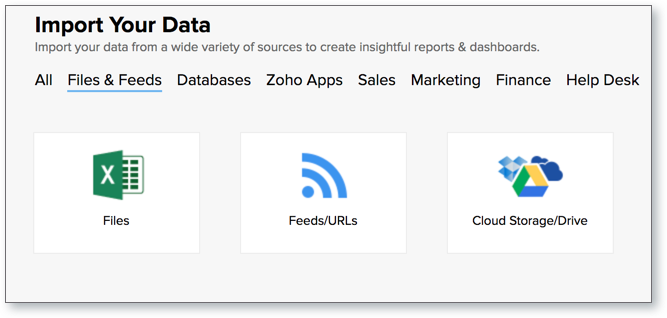
Homepage - Import Options in a Single Page
The new Zoho Analytics homepage layout will allow you to easily spot all the import options in a single page. Until now, users had to navigate across pages to check out the available import options.
We request you to check out our new layout and share your feedback.
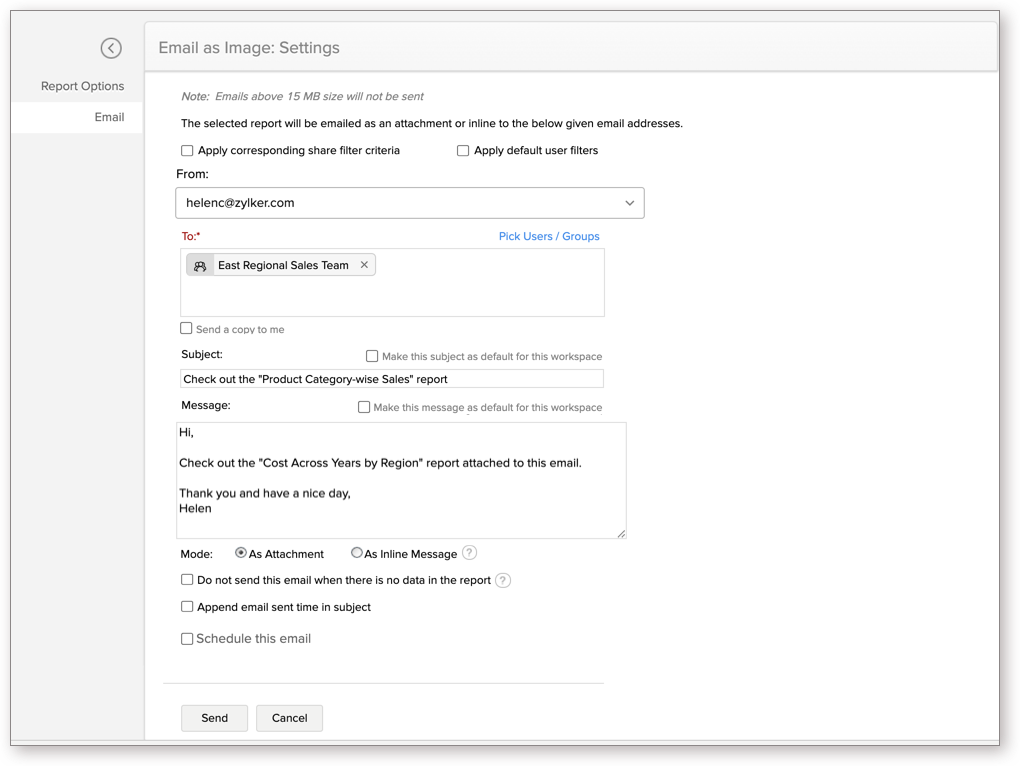
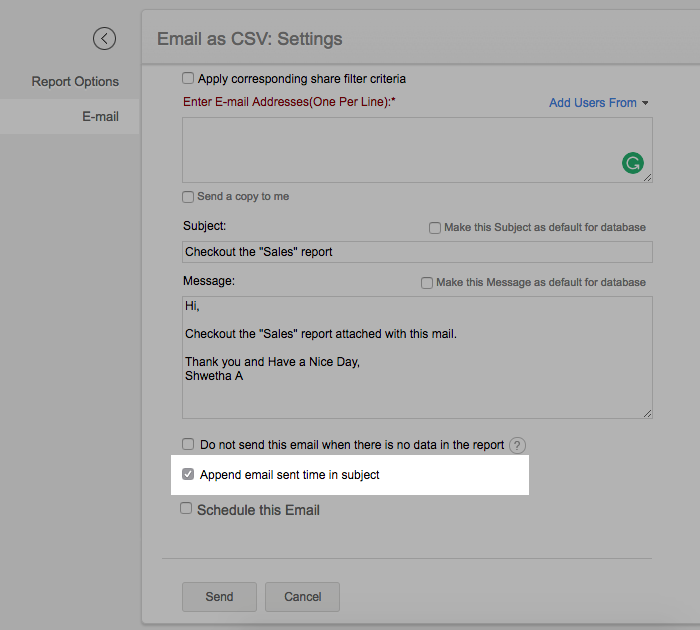
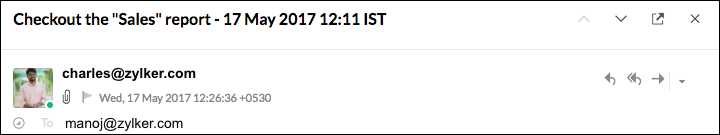
Send Email - Option to Append Email Sent Time
You can now choose to display the exact time when the report was generated in the subject line of the email while emailing reports and dashboards. To use this feature select the option "Append email sent time in subject" in the Email Settings window.
May 09, 2017
Beta Release: Zoho Desk Advanced Analytics Add-on
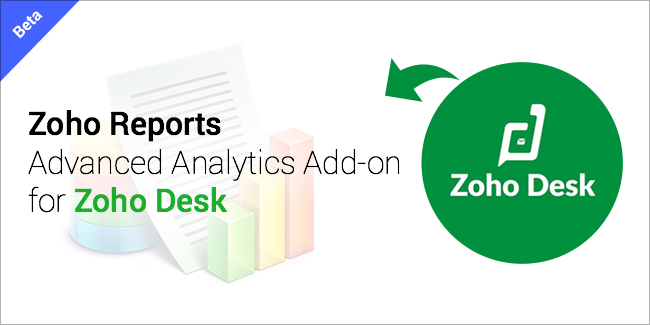
We at Zoho Analytics are happy to announce the availability of Zoho Desk Advanced Analytics (Beta). This add-on enables Zoho Desk users to easily analyze their help desk data and keep track of their key help desk metrics.
The Zoho Desk Advanced Analytics connector comes bundled with over 75+ domain specific default reports & dashboards such as agents' performance, ticket inflow, satisfaction rating, and much more. Apart from this, you can also create insightful reports & dashboards for indepth analysis.
- The Zoho Desk advanced analytics add-on is currently in public beta testing. Therefore, you may encounter certain functional bugs and limitations.
- This add-on is currently enabled only for customers in the paid plan (Standard and above).
You can quickly review the default reports and dashboards from the Zoho Desk Sample Reporting database.
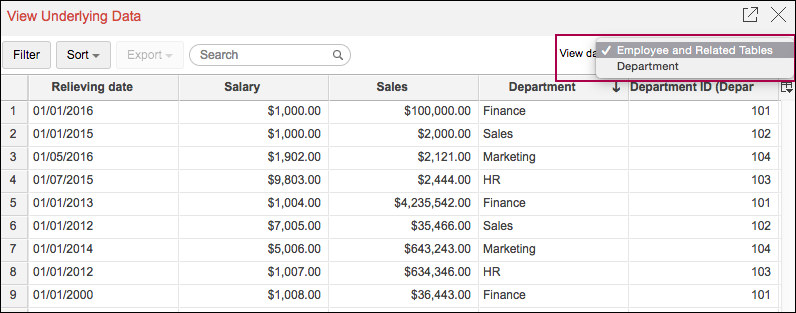
View Underlying Data Enhancement for Related Tables
So far when you create a report using multiple tables, you will be able to view the underlying data of the tables separately. Zoho Analytics has now enhanced this feature in such a way that when you access the View Underlying Data option, the data from all the related tables will be joined and displayed as a single table. This will be of great use to those who wish to view the joined data in a single shot.
Before this update:
The below screenshot highlights how the data tables used to be listed separately in the View Underlying Data. You need to select each of the table seperately to view the underlying data of that table.
After this update:
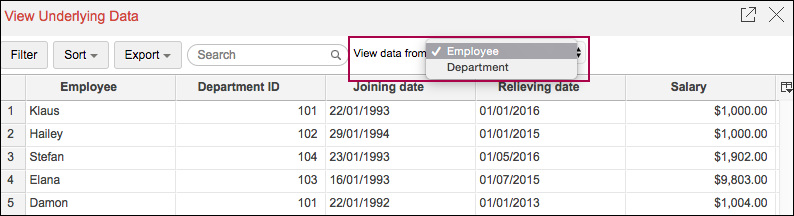
By default the View Underlying Data displays the data from the base table joined with the columns from the related table. You can also access the tables individually to view the underlying data.
In the below screenshot the Employee and Related tables (ie.. the Employee and the Department table) is selected by default. If you wish to view the data pertaining to the Department table alone, you can do so by selecting Department from the View Data from dropdown.
While sharing the report you can select the columns that you wish to display under "View Underlying Data" option. Refer Sharing and Collaboration to learn more.
In the user interface, you can also choose to Show/Hide the columns as you wish using the Show/Hide icon as highlighted below.
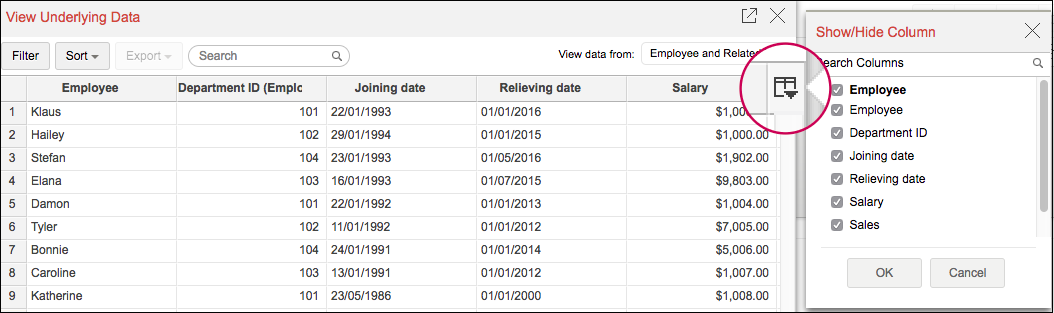
Click here to learn more about the View Underlying data feature.
May 24, 2017
Improvements in the Lookup Column Feature
We are rolling out a few enhancements to the lookup column feature to further enhance its usability.
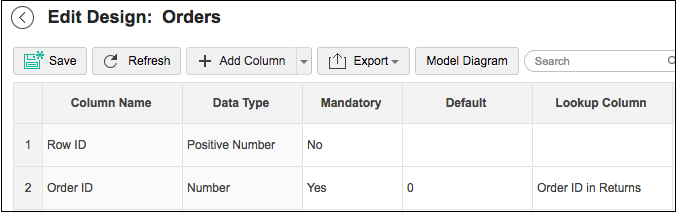
Specify data type for lookup column: Users can now change the datatype of the lookup column. Until now, the child column will share the data type of the parent column. With this update, you can set a specific data type for the child column. You can change the data type of the lookup column using the Edit Design option in the table.
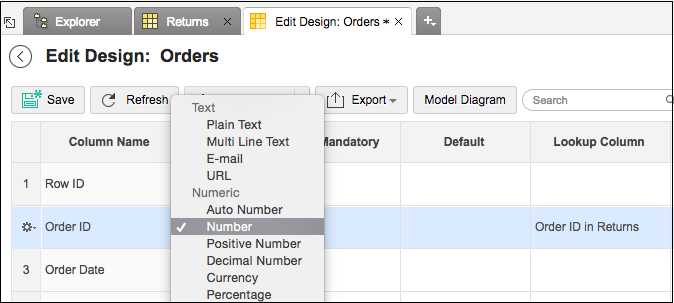
Support for Default and Mandatory Values: You can now specify Default and Mandatory values for a lookup column. You can do this using the Edit Design option in the table.
Lookup column over a looked up column: You can now make a looked up column (in the parent table) to also be a lookup column referring to another table (grandparent). This feature was not supported until now.
Behavior change - Action on deleting values in a lookup column: From now on when you create a lookup column, by default no action will be taken on the child column upon deleting the values in the corresponding parent column.
Until now Zoho Analytics provided options to delete the values in the child column when you delete the values in the corresponding parent column. This option has been removed with this update as it was found to be less frequently used and had high performance overhead. For users who have already been using this option, we will continue to support it. However, we would like to emphasize on the fact that "Delete the corresponding values in the child column" option will not be supported for the new lookup columns that you create henceforth.
Apr
Apr 4, 2017
Zoho Finance Analytics expands with support for Zoho Invoice
The Zoho Finance advanced analytics add-on (so far called as Zoho Books Advanced Analytics) gets much more power packed with the Zoho Invoice integration. You can now import your Zoho Invoice organization data into Zoho Analytics for advanced reporting and analysis. Till date, this add-on supported analytics only for Zoho Books. From now on you can import and analyze both your Zoho Books as well as Zoho Invoice modules.
We have plans to support more applications of the Zoho Finance suite in the future.
Renamed Custom Formula to Formula Column
We have renamed the option Custom Formula to Formula Column. The Formula column option adds a new column to your data table, whose values are derived based on the calculation/formula defined. You can define any powerful mathematical formula by invoking Add > FormulaColumn from the table.
Apr 19, 2017
Beta Release: Teamwork Projects Advanced Analytics Add-on
We at Zoho Analytics are very happy to announce the release of Zoho Analytics Advanced Analytics Add-on for Teamwork Projects (Beta). This add-on empowers the users of teamwork app with advanced analytical capabilities thereby giving a greater visibility & control on their project execution.
The Teamwork Advanced Analytics connector comes bundled with over 50+ default reports and dashboards that will help you keep track of your Key Project Metrics. You can also create insightful reports & dashboards over your Teamwork data for indepth project analytics.
- The Teamwork Projects advanced analytics add-on is currently in public beta testing. Therefore, you may encounter certain functional bugs and limitations.
- This add-on is currently enabled only for customers in the paid plan (Standard and above).
Mar
Mar 23, 2017
Microsoft Dynamics CRM Advanced Analytics (Beta)
We at Zoho Analytics are extremely excited to present to you the Microsoft Dynamics CRM advanced analytics add-on (Beta). This add-on empowers you with analytical capabilities over your Microsoft Dynamics CRM data thereby giving you a greater visibility on your Sales data.
The add-on comes with over 100+ handpicked reports and dashboards that you will find of great value. You can also create insightful reports to predict your sales pipeline, know your sales win/loss rate, Top 5/Bottom 5 sales persons and do much more with ease.
To explore further, please refer to the below links:
Microsoft Dynamics CRM Help Document | Microsoft Dynamics CRM Sample Reports
- The Microsoft Dynamics CRM advanced analytics add-on is currently in public beta testing. Therefore, you may encounter certain functional bugs and limitations.
- This add-on is currently enabled only for customers in the paid plan (Standard and above).
New option to Setup Zoho CRM Analytics from Zoho Analytics
You can now setup the Zoho CRM Advanced Analytics Add-on from within the Zoho Analytics interface itself. Till now, this was possible only from the Zoho CRM interface. This feature provides a much easier option for the Zoho Analytics users to setup and manage the integration from within Zoho Analytics.
Watch the below presentation to learn about setting up the Zoho CRM Advanced Analytics Add-on from Zoho Analytics.
Mar 30, 2017
New Packed Bubble Chart type for Zoho Analytics
The Packed Bubble chart type is used to display data in a cluster of circles or bubbles. They are used to display the values disregarding the axes. The difference between a normal bubble chart and a packed bubble is that the latter is tightly packed rather than spread over a grid. You can use a packed bubble chart to visualize large amount of data in a small space.
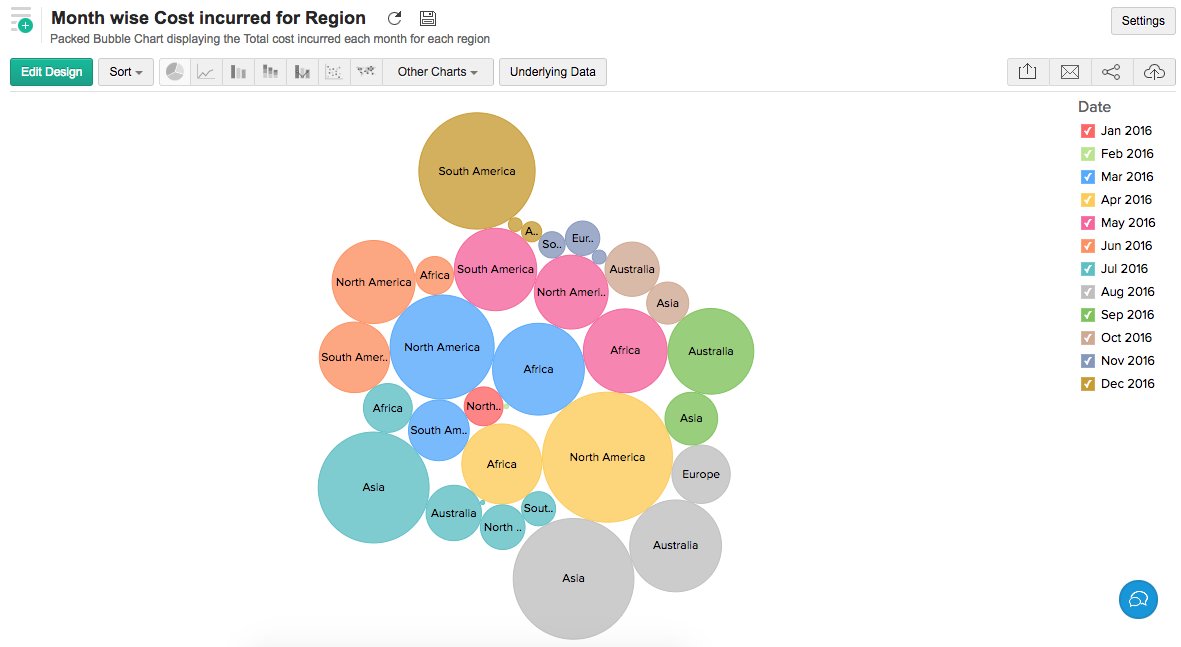
Please do note that, this chart type is available only as a part of the New Charts feature which is currently in Beta.
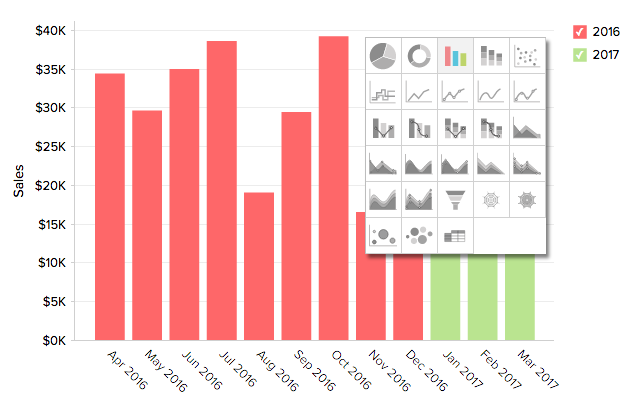
Enhanced Chart chooser dialog for Dashboards and Embedded views
We have now revamped our Chart Chooser option for dashboards and Embedded Views. Our new intuitive and smooth Chart Chooser option will help previewing the chart types available and switch between them real fast.
New Edit view option in Explorer
You can now easily edit your reports and dashboards by invoking the Edit option in the contextual menu of the corresponding view in the Explorer. This will directly open the view in the Edit mode real fast, thereby saving few clicks.
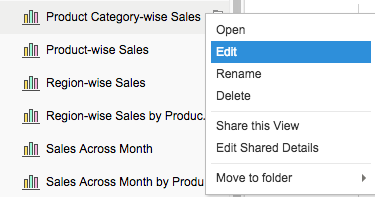
- Please do note that this option is not available for tables.
Support to Export upto 3 million cells in Excel file format
You can now export table like views (Pivot, Summary, Tabular View, Tables & Query Tables) with up to 3 million data cells as Excel files. Until now, it was possible only to export up to 1 million cells.
Feb
Feb 23, 2017
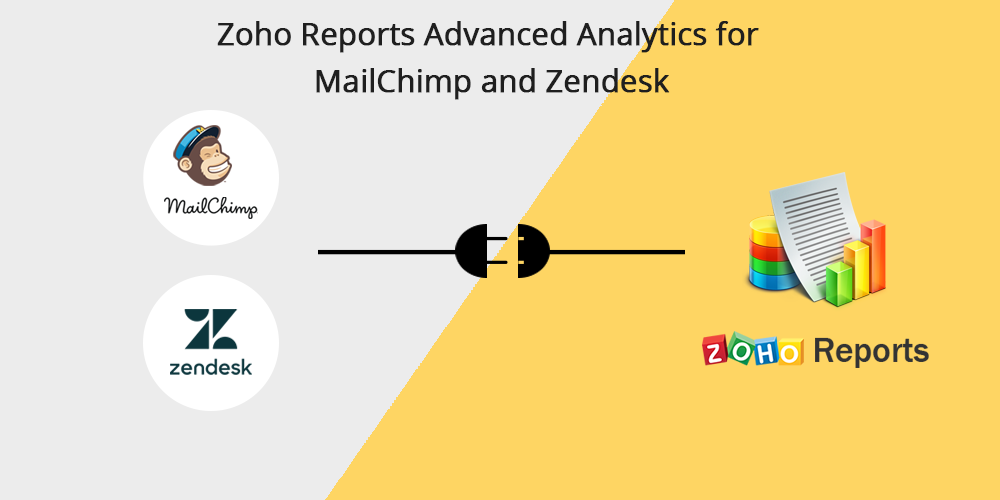
Zendesk and MailChimp Analytics - Public Release
We at Zoho Analytics are extremely happy to announce the general release of advanced analytics connectors for Zendesk and MailChimp.
Until now the beta version of these connectors were only available for the paid users of Zoho Analytics. With this general release it is made available for all Zoho Analytics users.
The add-ons are available Free in all paid plans of Zoho Analytics. It is priced at $15 per add-on/month in free edition.
Zendesk Advanced Analytics Add-on - Key Highlights:
- Support managers and technicians can easily analyze the help desk data in Zendesk to track & manage their key help desk metrics.
- Create and analyze reports such as Response & Resolution time, SLA compliance, Agents' performance, NPS score, Satisfaction rating and do much more.
- 75+ pre-built reports and dashboards focussed on help desk analytics, that you will find of great value.
MailChimp Advanced Analytics Add-on - Key Highlights:
- Product marketers and analysts can slice and dice their campaign data in MailChimp to track and manage their key campaign metrics.
- Create and analyse reports such as Open rate, Conversion funnel, Best performing campaigns, Email domain analytics and do much more.
- 50+ pre-built reports and dashboards focussed on marketing analytics, that you will find of great value.
Import Data from popular CRM Solutions using Flatly
Zoho Analytics now allows you to import data from various CRM services using a web automation app called Flatly. You can seamlessly pull data from popular CRM services such as Insightly CRM, Pipedrive and Base CRM into Zoho Analytics for Advanced Sales Analytics.
Jan
Jan 2, 2017
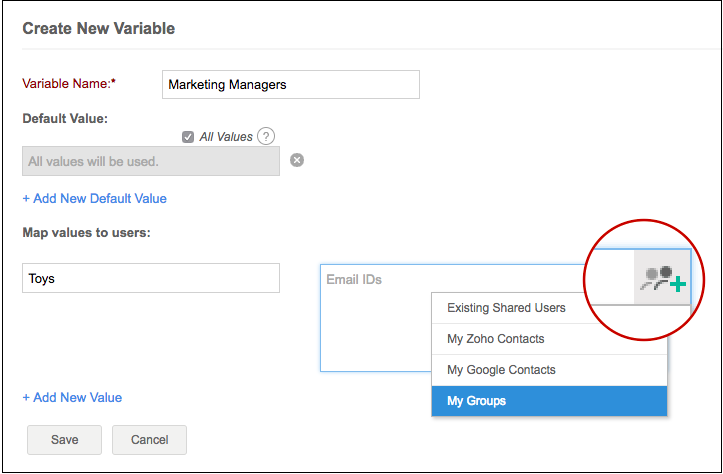
Variable Support for Groups
Zoho Analytics has now enhanced the Variable feature which was introduced recently to setup groups. You can now create variables and map the values to groups. If you have created groups for sharing and collaboration, you can map variable values to them.
To map a variable to a group
- Click the Add User/Group option in the Create New Variable page and select My Groups.
Cloud Databases: Hourly Periodic Import Schedule
Zoho Analytics recently released a very easy and simple approach to import data from Cloud databases. With this update we are supporting hourly periodic schedules to fetch the latest data automatically. The available options are:
- 3 hours
- 6 hours
- 9 hours
- 12 hours
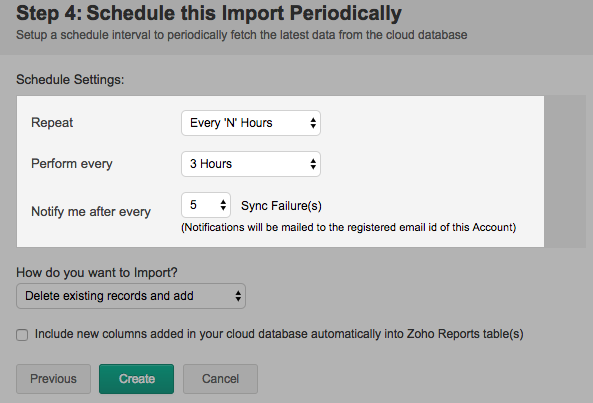
You can set this hourly periodic schedule while setting up the reporting database. Please do note that, this option is available only in the paid plans of Zoho Analytics.
Existing users, who have already setup the reporting database can change the interval using the Edit Setup option. Click to know more.
Check out updates in: 2017 | 2016 | 2015 | 2014 | 2013 | 2012 | 2011 | 2010 | 2009 | 2008 | 2007
2016
Dec
Dec 1, 2016
Public Release: Xero Advanced Analytics Add-on
We at Zoho Analytics are extremely happy to announce the general release of Xero Advanced Analytics Add-on. Till now the beta version of this connector was only available for the paid users of Zoho Analytics. With this general release it is made available for all the Zoho Analytics users.
The Xero add-on is priced at $15/month. This will enable you to import your Xero data into Zoho Analytics, and avail all the features in the Zoho Analytics free plan. This add-on is available free in all the paid plans of Zoho Analytics
Zoho Analytics advanced analytics add-on for Xero enables you to slice and dice your financial data and derive great insights. You can analyze and create reports such as financial overview, bills trend, pending invoices and do much more with Zoho Analytics. You can also combine the data from Xero with the data from other sources/services and do cross functional analytics.
Connect Live with Amazon Redshift Database
We recently released a new and simple method to import data directly from various cloud databases such as Amazon RDS, Amazon Redshift, Microsoft SQL Azure into Zoho Analytics. In addition to that we are introducing a simple and easy method to connect live with your Amazon Redshift database.
In this method data will not be imported from Amazon Redshift and stored in Zoho Analytics. Instead for every report that you create, Zoho Analytics will generate appropriate queries to fetch the required data from Amazon Redshift to show you the report.
- The live connect feature is available only in Zoho Analytics paid plans.
- The feature is currently available only for Amazon Redshift.
Dec 15, 2016
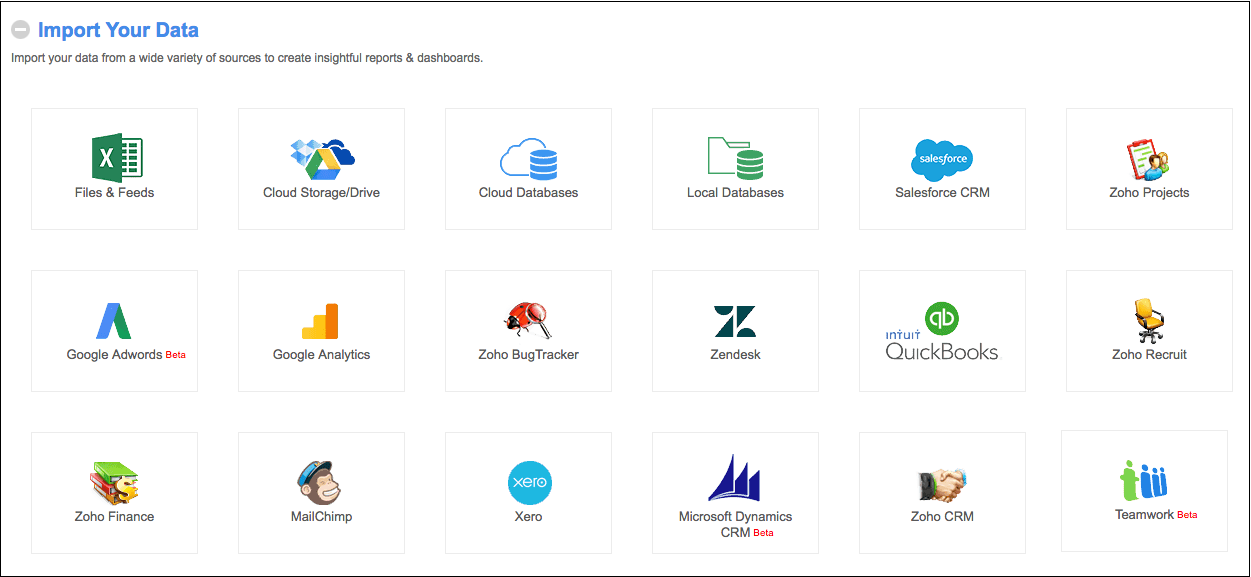
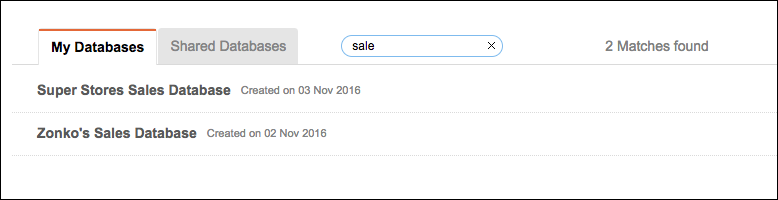
Subtle Changes in the Home page Interface
We have made the following changes in the Zoho Analytics home page.
1. The Create Workspace option has been renamed as Import Your Data to reflect the first step any user would perform upon logging into Zoho Analytics. You can continue importing your data from a wide variety of sources using this option as you used to with the create Workspace option.
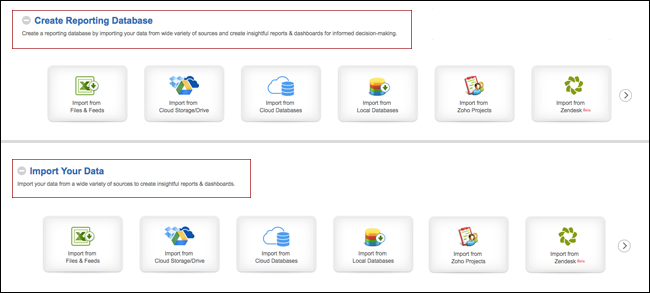
2. The search bar in the Zoho Analytics homepage has been made much faster. The search now suggests the database names as you type in making it extremely responsive.
Nov
Nov 7, 2016
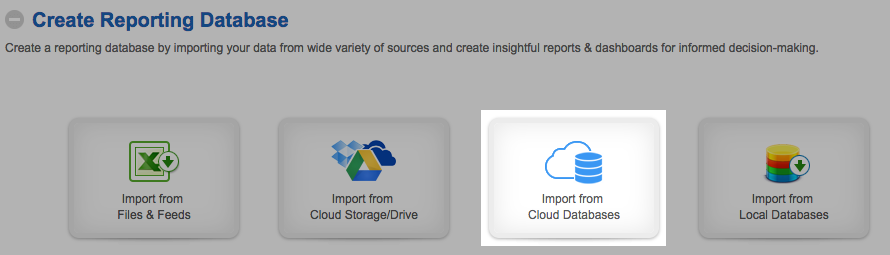
A simple approach to import data from Cloud Databases
We are introducing a very simple model to import data stored in your Cloud databases such as Amazon RDS, Amazon Redshift or Microsoft SQL Azure into Zoho Analytics for reporting & analytics. You can setup the import process using a simple setup wizard.
Till now, users had to download and configure the Upload tool to import data from the cloud databases. This new model does not require any software to be installed. You can completely setup and manage the import process from the Zoho Analytics web interface itself. You can also set up periodic schedules to have the latest data updated automatically into Zoho Analytics.
To import the data from the cloud databases, click the Import from Cloud Databases option in the Zoho Analytics homepage.
Click to learn more about importing data from cloud databases.
- In case you are already using the Upload tool, we strongly recommend you to use this new simplified import process to fetch your data from the Cloud databases into Zoho Analytics. This model is so easy that it will hardly take a few minutes to import your data into Zoho Analytics.
New Revamped Subscription page
We have completely revamped the interface design of our subscription page. You can now completely manage your subscription including upgrades and downgrades from this page.
Incase you have purchased more than one Zoho Product, you can manage the subscription for all the products from this page.
Nov 18, 2016
Improved Drill Down Feature (Available only in New Charts)
Zoho Analytics now allows you to dynamically select the drill down path from the Zoho Analytics chart interface itself. Earlier, when you define a drill down path, you will be allowed to traverse only through the defined path. Now, the path that you define will be listed along with a wide list of connected columns that you can drill down with.
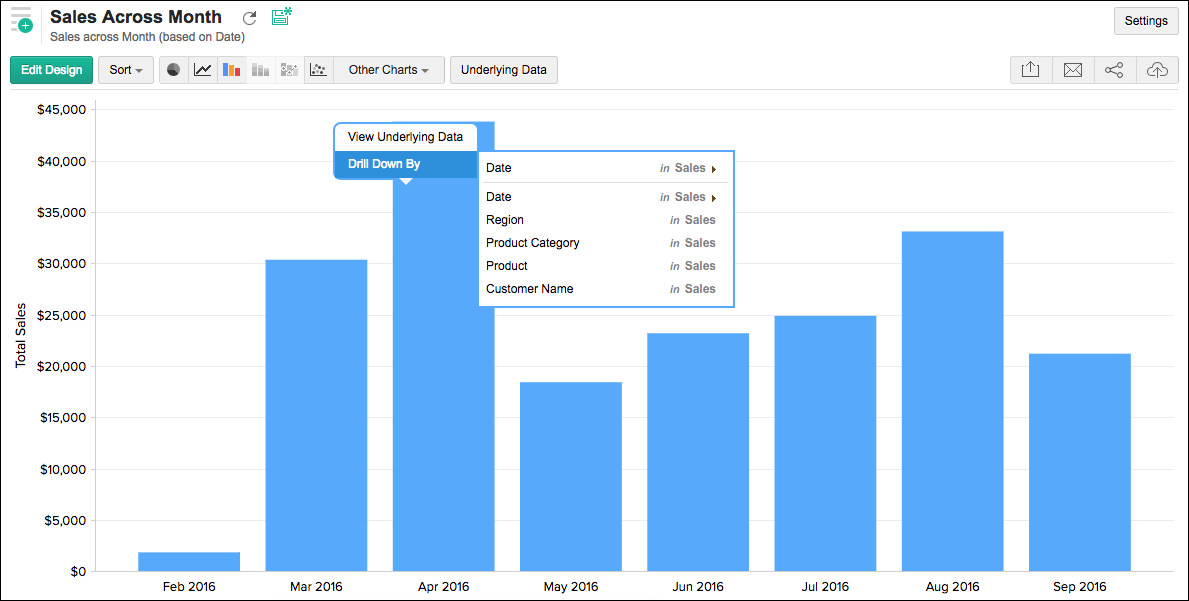
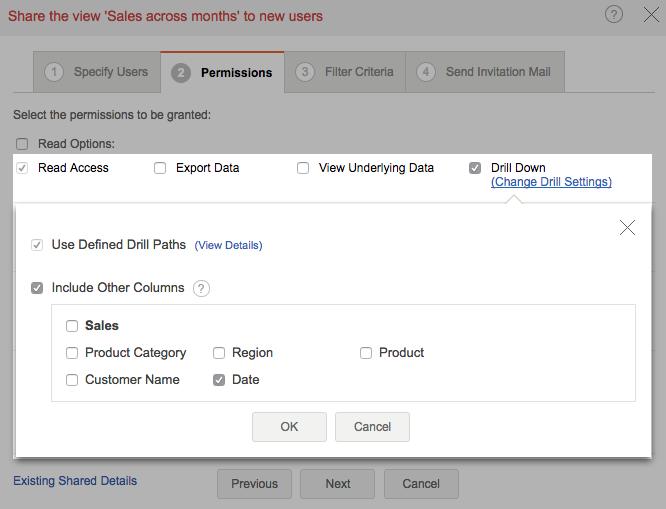
You can also configure the list of additional columns that are to be listed as a part of the drill down while sharing a chart.
In order to dynamically drill-down, click on the chart area and select Drill Down by.
- This option is available only in the New Charts library which was released for public beta testing recently.
Week Settings at Database Level
You can now update the week settings such as start day of the week, week format and week mode at the database level. All the reports in the database will use this week setting subsequently.
To set this,
- Login to Zoho Analytics
- Open the corresponding Workspace
- Click Settings > General
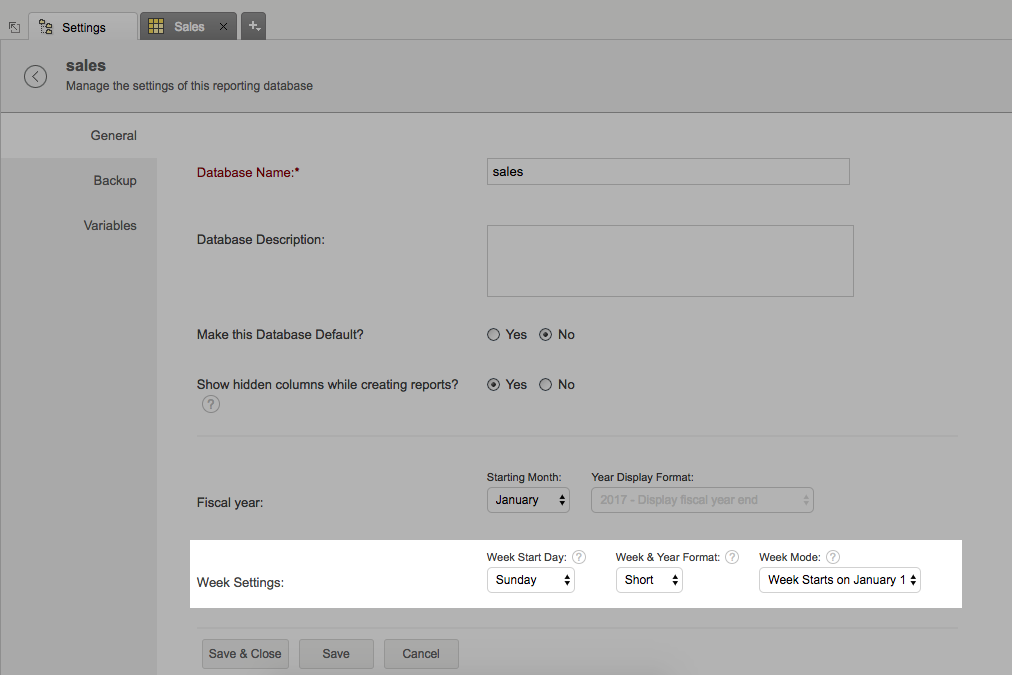
- This function will not be available if you have switched to the new charting library. We are working on it and will be released soon.
Oct
Oct 7, 2016
Enhancements in User Filters
In continuation with our updates on the user filter feature (Timeline Filter), we have once again come up with a list of enhancements to increase its usability.
In this update the following features have been supported:
1. Highlighting applied filters: This feature automatically highlights the user filter that has been applied on your report/dashboard with a subtle green color. This helps you quickly identify the filter that has been applied.
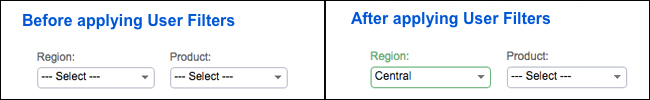
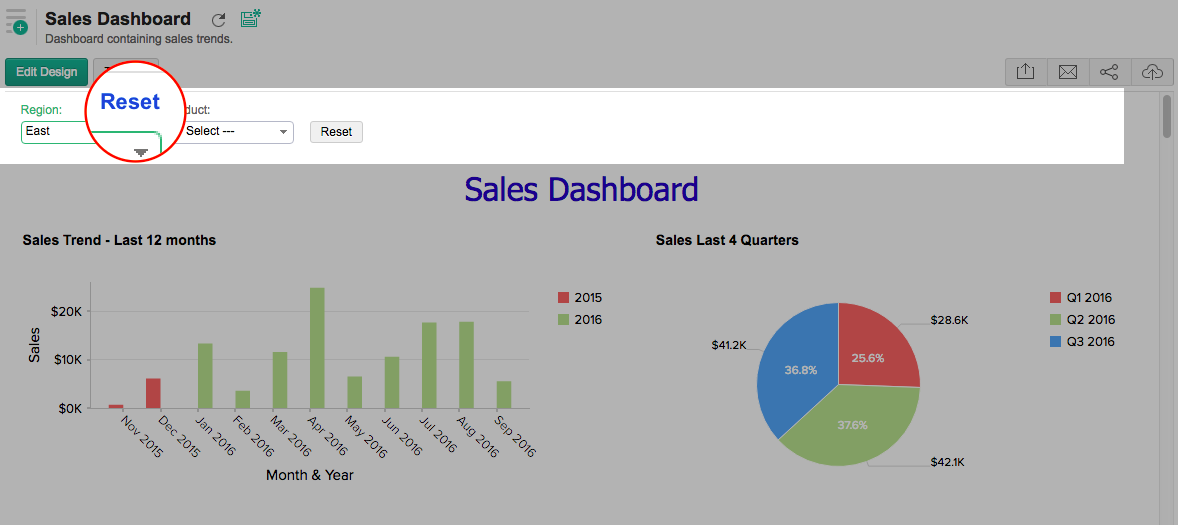
2. Filter Level Reset: You can now reset a particular user filter that has been applied. To reset individual filters, click the Reset link available on the top of the corresponding filter.
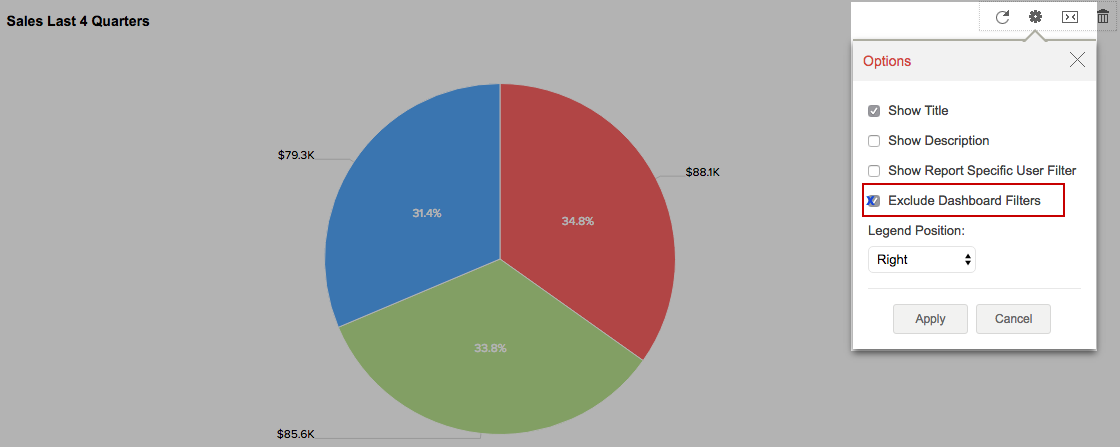
3. Excluding Dashboard Filters: You can now choose to exclude a particular report in a dashboard if you do not want the user filter to be applied on it.
To exclude a report,
- Click the Options icon of the report in the dashboard designer
- Select Exclude Dashboard Filters.
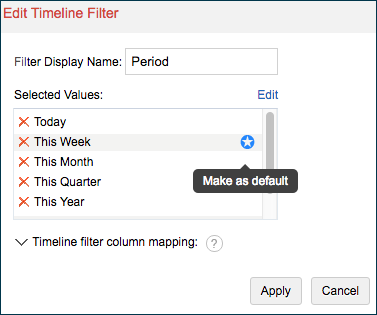
4. Default Value in Timeline Filter: You can now set a default value for the timeline filter too.
To set a value as default,
- Click the Edit icon on your timeline filter
- In the Selected Values list click the Star icon that appears on mouse over to mark the value as default.
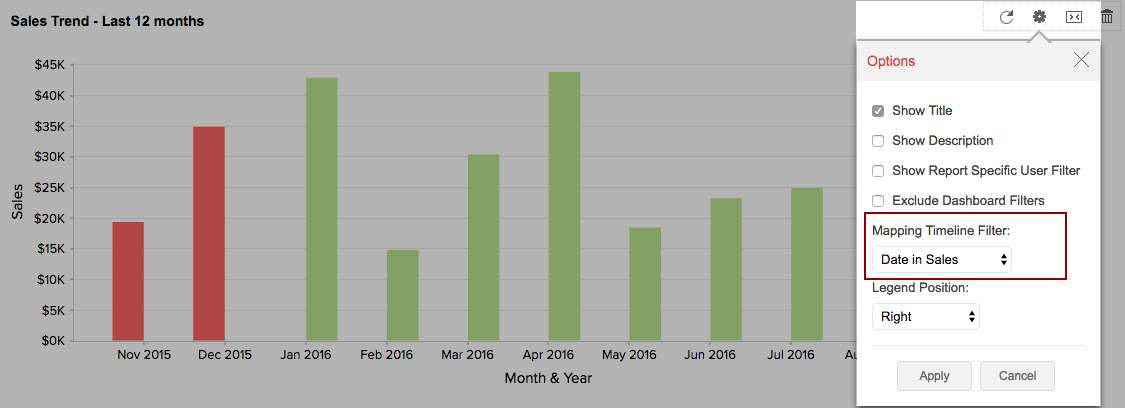
5. Timeline Date Column mapping: You can now map a date column to be used for a timeline filter at a report level.
- Click the Options icon of the report in the dashboard designer
- Select the date column from the Mapping Timeline Filter drop-down.
Oct 17, 2016
Introducing the Google AdWords Advanced Analytics Add-on (Beta)

We at Zoho Analytics are extremely excited to present to you the Google AdWords advanced analytics add-on (Beta). This add-on enables you to import your Google AdWords campaign data into Zoho Analytics for powerful reporting and analysis. You can easily create reports to track your key ad campaign metrics such as best performing campaigns, conversion funnel, clicks vs conversion, ad analytics and much more...
Click to learn more about the Google AdWords Advanced Analytics Add-on.
- The Google AdWords advanced analytics add-on is currently in public beta testing. Therefore, you may encounter certain functional bugs and limitations.
- This add-on is currently enabled only for customers in the paid plan (Standard and above).
Custom Fields support in ManageEngine SDP analytics add-on
If you are using the ManageEngine ServiceDesk Plus advanced analytics add-on, you can now import the custom fields available in ServiceDesk Plus account into Zoho Analytics. These custom fields will be automatically fetched upon updating your SDP pack to version 9229 or above.
Click to know more about the ManageEngine Advanced Analytics Add-on.
Sep
Sep 20, 2016
Introducing Variables Feature in Zoho Analytics
Zoho Analytics has introduced a new feature called Variables. Variables are placeholders that helps database administrators/owners to assign dynamic values for individual users of the database.
You can use these variables as a part of the Sharing filter criteria to filter reports dynamically based on the user who has logged in. You can currently use variables in Sharing Filter criteria. We plan to support variables in features such as user filters, formulas etc. very soon.
You can create and manage variables from the Variables tab in the Settings page. Click here to know more.
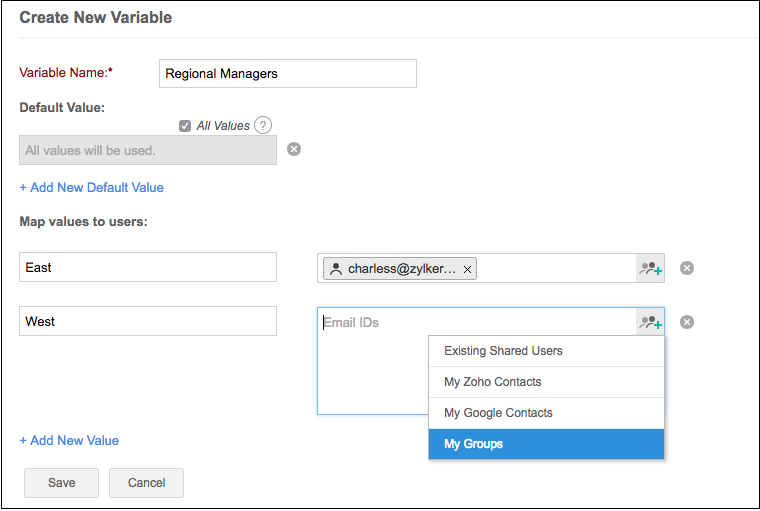
Support for Bubble Charts
We have introduced a new "Bubble Chart" type into Zoho Analytics charting library. Bubble charts can be really useful if you want to visualize your data highlighting the magnitude/weightage of a data point with sizing. You can use a bubble chart wherever a Scatter plot is used, with scatters points being replaced by bubbles. The size of the bubble will be determined by the data column dropped in the new Size shelf of the Chart designer.
This chart type is available only in the "New Charts" library which was released for public beta testing recently.

Sep 27, 2016
Beta Announcements
We are extremely happy to announce the Beta releases of two much-awaited integrations with Zoho Analytics.
- As these integrations are currently in public beta testing you may encounter certain functional bugs and limitations.
- This add-on is currently enabled only for customers in the paid plan (Standard and above). We will come up with a pricing plan as a part of the general release.
MailChimp Advanced Analytics Add-on (Beta)
The beta version of Zoho Analytics Advanced Analytics Add-on for MailChimp enables you to easily analyze your email campaigns in MailChimp and derive great insights, with the in-depth reporting and analytical capabilities of Zoho Analytics. Product marketers and analysts can slice & dice their campaigns data, measure and track key campaign metrics and effectively execute their email campaigns.
This add-on comes bundled with over 40+ insightful reports such as campaign conversion funnel, active days of a campaign, customer domain specific analytics etc. that enables you to analyze your data deeper. You can also create your own reports using the easy to use drag and drop interface.
Xero Advanced Analytics Add-on (Beta)
Zoho Analytics provides financial analytical capabilities using its dynamic and robust integrations with Zoho Books and QuickBooks Online. Now, it's time for Xero to join the league.
Zoho Analytics advanced analytics add-on for Xero empowers your financial data and helps you derive great insights. You can create and analyze reports such as financial overview, bill trend, pending invoices and do much more. The Xero Analytics add-on comes with 45+ insightful reports and dashboards that are capable of giving you a greater visibility on your financial data.
Support to Set 'Column Width Ratio' while Exporting as PDF
Zoho Analytics now provides you with options to set the column width ratio while exporting any tabulated report (Pivots, Tabular View and Summary View) as a PDF. You can choose to either export the report with
- Equal width for all columns
- Proportionate width as in the report
Aug
Aug 24, 2016
Chart Chooser Dialog Revamped
In our continued efforts to provide visually rich and powerful chart engine, we recently revamped our entire charting library and announced its public beta. In continuation of that, we have now revamped our Chart Chooser dialog. Our new intuitive and smooth Chart Chooser dialog will help previewing the chart types available and switch between them real fast (with lesser clicks).
This dialog can be invoked using the Other Charts option in the toolbar. Try out and post your feedback!!
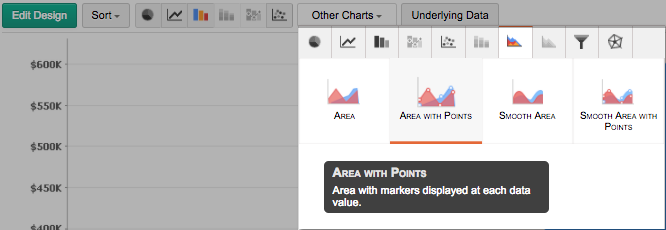
Enhanced Formula Editor with Suggestions
Zoho Analytics formula editor has been enhanced to support features such as keyword highlights, suggestions, error messages etc.
In this update the following features have been supported:
- Suggestion: Provides you the possible autofill suggestions as you type in the formula.
- Keyword Highlight: Highlights the keywords in the formula for better readability and understanding of the formulas.
- Warning/Error: Displays intuitive warning or error message in the case of any inaccuracy or error in the formulas.
Click to learn about creating formula columns.
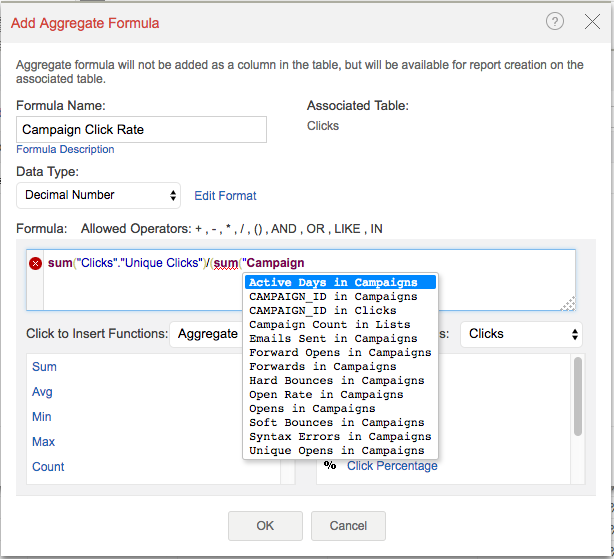
Jul
Jul 07, 2016
FTP Import Support in Zoho Analytics
Zoho Analytics now supports data imports from your FTP and SFTP servers. This will be extremely beneficial for users who store their data on these servers. Zoho Analytics also allows you to periodically schedule importing of data from your local/remote servers. With this, you can have the latest data synced into Zoho Analytics.
Click here to learn about importing data from a FTP server into Zoho Analytics.
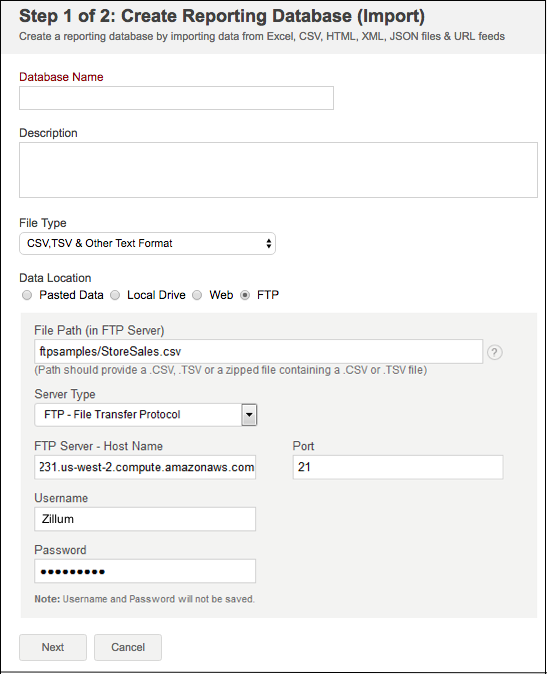
Jul 14, 2016
Announcement: Zoho Analytics Advanced Analytics for Zoho Books and QuickBooks Online
We are extremely happy to announce that Zoho Reports has now released Advanced Analytics Add-on for the two most popular accounting softwares - Zoho Books and QuickBooks Online.
Zoho Analytics offers seamless integration with these two softwares. This add-on empowers you with analytical capabilities over your Zoho Books/QuickBooks data. It also gives you a greater visibility on your financial data and helps you stay on top of the cashflow.
The add-on comes with a set of 75+ pre-packaged reports and dashboards, which you will find useful and valuable. Besides this, you can also create your own reports and dashboards for in depth financial analysis.
Refer to the below links to know more about this advanced analytics add-on
Zoho Books Advanced Analytics (help documentation) | Sample reports and dashboards
QuickBooks Advanced Analytics (help documentation) | Sample reports and dashboards
Jul 27, 2016
Beta Announcement
We are glad to announce the availability of two important features for public beta testing. As these features are in beta, we would love our users to try and share their valuable feedback. You can share your feedback by clicking the Feedback link inside Zoho Analytics.
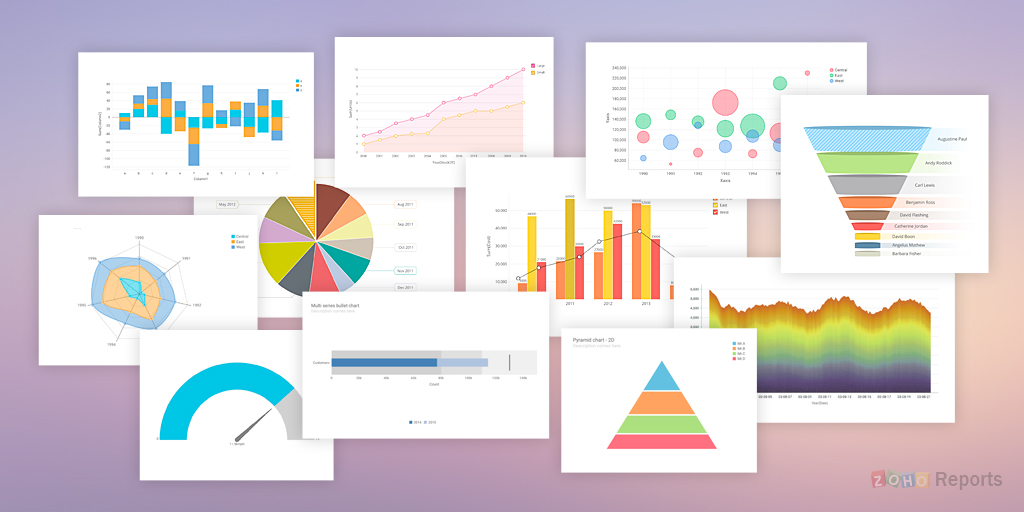
We have completely revamped our charting library. Our new charts have been built using the latest client technologies such as HTML 5, Javascript, CSS & SVG. It is visually appealing, fast, light and offers a wide range of customization options. Not to miss we are adding a whole variety of new chart types too...
You can try the new charts (beta) by clicking Try New Charts link present in the top right corner of Zoho Analytics.
Coming Soon in General Release: New chart types, New KPI widgets, New set of customization options and much more...
Zendesk Advanced Analytics Add-on:

The beta version of the Zendesk data connector enables you to view and analyze your helpdesk metrics in Zendesk. You can slice and dice your data and create insightful reports such as active tickets by agents, resolved tickets trend, escalations and do much more
Coming Soon in General Release: More than 50+ sample reports and dashboards.
- Please do note that as these features are currently in beta testing and hence they are subject to behavioral change.
Jun
Jun 23, 2016
Timeline Filter for Dashboards
Zoho Analytics has introduced a new type of user filter named Timeline Filter. This feature allows you to create a common Date/Period user filters that can be applied on all reports in the dashboard. This user filter is different from the other filters, as it is not tightly bound to any (date) column in a table.
With this timeline filter you will be able to setup a common Date/Period user filter independent of the tables on which the reports have been created.When you use the timeline filter in a dashboard, Zoho Analytics will apply the criteria on all reports, matching it with the best possible date column associated with the report. By default, if the report has a date column, it will filter using it. The matching date columns can also be customized. Since this is a common period filter, you can setup only one timeline filter in a dashboard
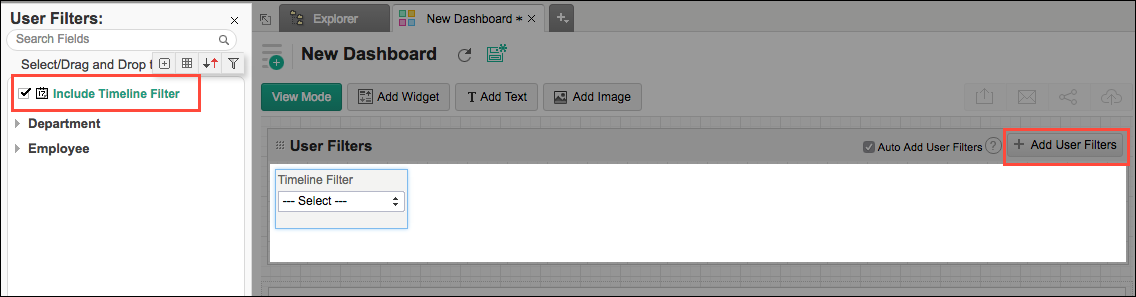
May
May 5, 2016
Support to Auto Identify Look-up Columns
Zoho Analytics allows you to blend/join data across multiple tables using a special feature called Auto-Join. This feature is enabled when you associate tables through a common look-up column.
Zoho Analytics has now made the process of defining the look up easier. We now support auto identification of columns that can be linked (looked-up) with your existing tables in the same database at the time of import. It just needs a review and confirmation. Click here to know how.
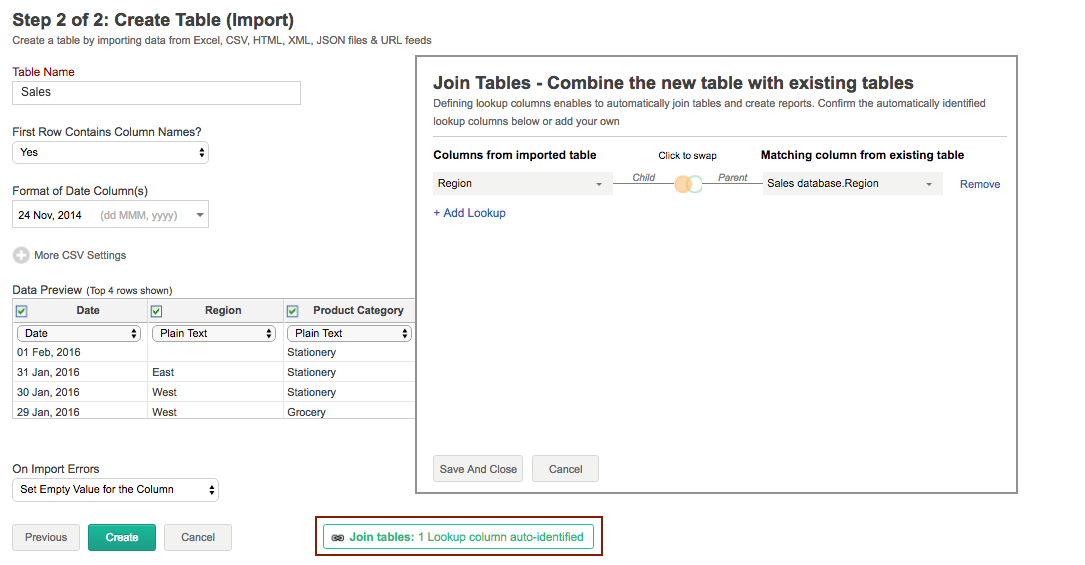
Support for Email Schedules with Default User Filter
Zoho Analytics now allows you to set email schedules by applying the associated default user filters on the reports that are mailed. To apply this feature, select Apply Default User Filter in the Email: Settings dialog.
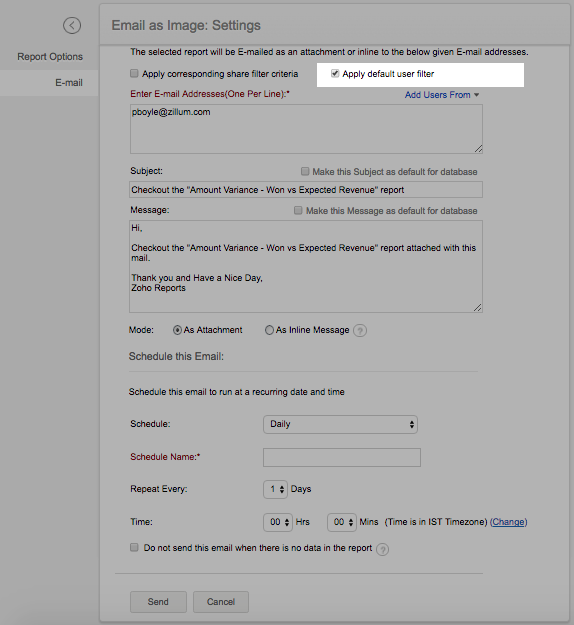
May 13, 2016
Zoho Analytics API - Client libraries for PHP & GO released
Zoho Reports has now included the API client libraries for the popular PHP and GO languages. This enables developers to easily build/integrate the powerful reporting and analytical capabilities of Zoho Analytics into their PHP or GO applications.
Zoho Analytics already provides client libraries in a variety of popular programming languages like Java, C# and Python. You can learn about Zoho Analytics API from our help documentation.
May 24, 2016
New Settings Page for Workspaces
Zoho Reports has now introduced a new settings page that is specific for each Workspace. You will be able to manage your database preferences from this settings page. With this option, you will be able to configure a wide range of features such as starting day of the week, starting of a financial year, data backup and so on.
To access the settings page, click the Settings button in the Explorer tab of the corresponding Workspace.
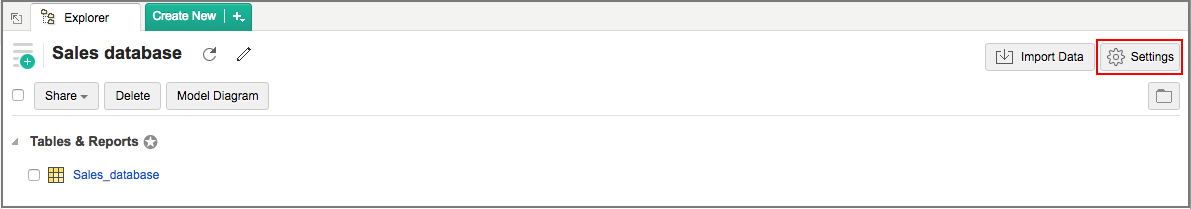
Refer to this help documentation to know about the available options.
Apr
Apr 05, 2016
Introducing API Usage Metrics and Pricing
Zoho Analytics now introduces a daily API usage limit in accordance with your pricing plan. Zoho Analytics API usage will be measured based on units consumed and the frequency of API calls. The API usage limit is capped to your pricing plan. You can refer to the below table to know the API usage limit for your plan.
| Plan | API Units per Day |
| Free | 1,000 units |
| Standard | 10,000 units |
| Professional | 25,000 units |
| Professional Plus | 50,000 units |
| Enterprise | 100,000 units |
You can also purchase API units as add-ons. To know more about the usage limit or how it is calculated, refer to this help documentation.
To purchase API units as add-ons:
- Log into Zoho Analytics.
- Click the Subscription link on the top right corner.
- Click Manage your Plan button under your Current Plan tab.
- You can select your API add-on plan from the drop-down menu.
- Click Proceed to make the payment.
- This is applicable only for users who sign-up for Zoho Analytics, starting today. We will be gradually moving the existing users into this new API usage plan.
Apr 13, 2016
Use 'Look-up' Fields in Formula columns
Zoho Analytics now supports 'Look-up' fields in formula columns. Previously, it was not possible to use formulas on a lookup field. You can refer to the Defining lookup section in this help documentation to learn about creating a lookup.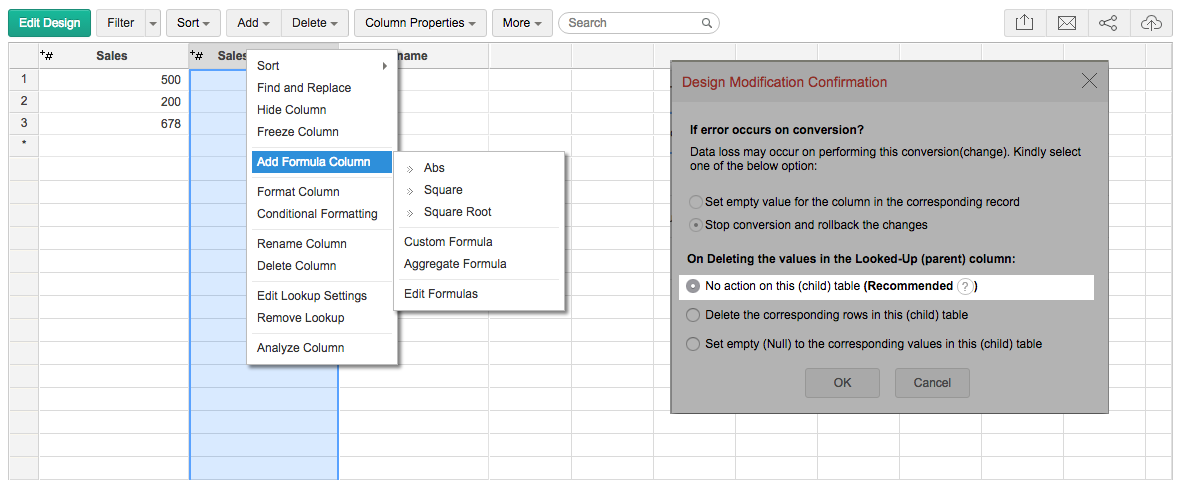
- This functionality will be applicable only if the lookup column has been created with the delete criteria set as No Action on this (child) table.
You can use the lookup field to create both custom and aggregate formulas. Refer to the topic 'Adding Formulas' to learn about creating a formula column.
Full Join Support for Query Tables
Zoho Analytics now supports full join for query tables. The FULL JOIN combines the results of both left and right outer joins.
The joined table will contain all records from both the tables and will fill in 'null' in the case of missing values. You can refer to this video on 'How to create a query table'.
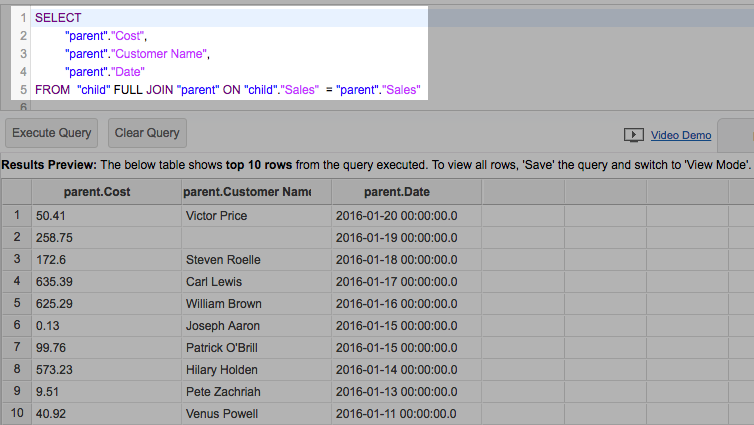
Custom Field Support in Zoho Projects Advanced Analytics Add-on
You can now include the custom fields available in your Zoho Projects portal in the reports that you create in the advanced analytics add-on. These custom fields will be automatically fetched upon the next schedule. Refer Zoho Projects: Advanced Analytics add-on to know more.
Apr 26, 2016
Enhancements in Conditional Formatting
Conditional Formatting in Pivots and Summary Views offers enhanced features like adding/formatting text and icons to highlight your condition in addition to the earlier formatting capabilities. Click to know more.
![]()
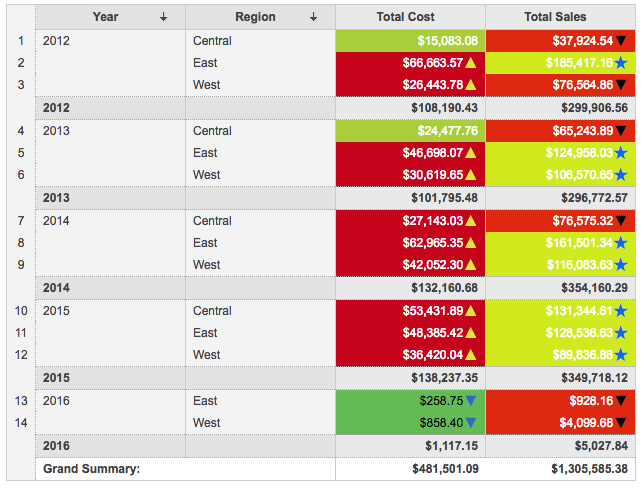
Wrapping Column Headers in Pivots and Summary Views
Zoho Analytics now allows you wrap lengthy column headers in Pivots and Summary Views. You can use this feature by clicking the Settings button in the toolbar and selecting Wrap Text in Column Headers.
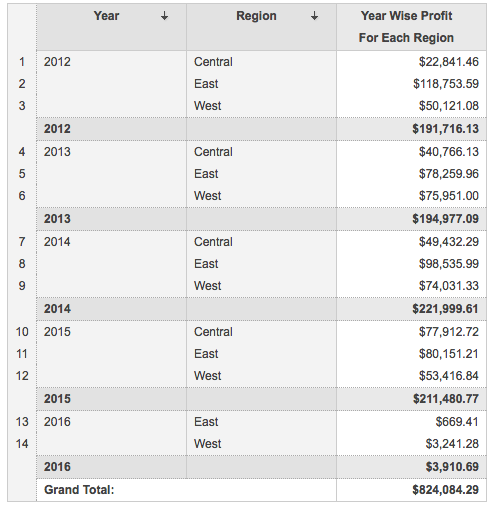
Mar
Mar 2, 2016
KPI Widget Enhancement
Customizing "Null Value" Display:
Zoho Analytics now provides an option to customize the display of unknown values in your widget. You can now customize both the label as well as the value for displaying null values.
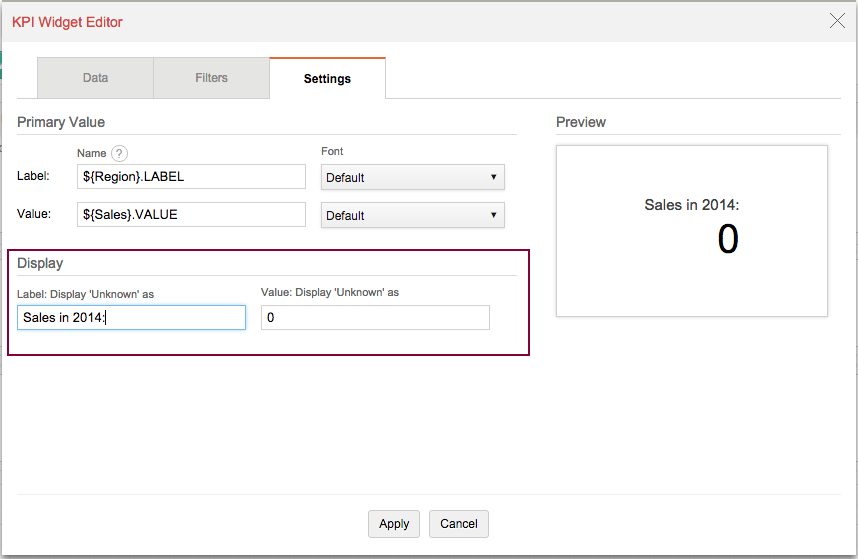
Mar 14, 2016
10 Fold Increase in Rows Limit in Free Plan !!
Zoho Analytics now offers 100,000 rows limit to all Free plan users. This is 10x increase from the current limit of 10,000 rows. Existing free plan users can avail this by visiting the Subscription page and following the directions from there on to upgrade their account.
Microsoft Edge Browser Support
In addition to Google Chrome, Firefox, Safari and Internet Explorer, we now support Microsoft Edgebrowser.
Mar 24, 2016
Pivot Enhancements
Display Missing Value Option
Zoho Analytics now supports the Show Missing Values feature for Pivots too. Recently, this feature was introduced in charts. This allows you to view the in-between missing values in your data. This can be applied on a Date or a Category column.
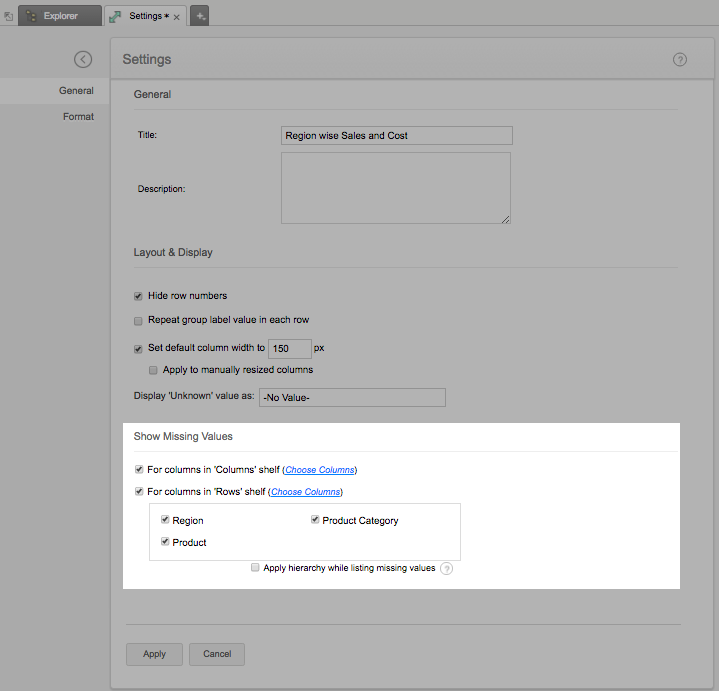
So far when you create a pivot with a date or category column, if a particular category does not have any value, then the Pivot would skip displaying that data. With this new option you can choose to display the record which does not contain a value.
You can apply this function for the columns in both "Rows" and "Columns" shelves. You can also enforce hierarchy on the selected columns. Click to know more.
Mar 30, 2016
Campaign Module Support For Zoho CRM
Zoho Analytics now supports the following modules in Zoho CRM:
- Campaign
- Campaign Lead Status
Existing users can include these modules using the Edit Setup option.
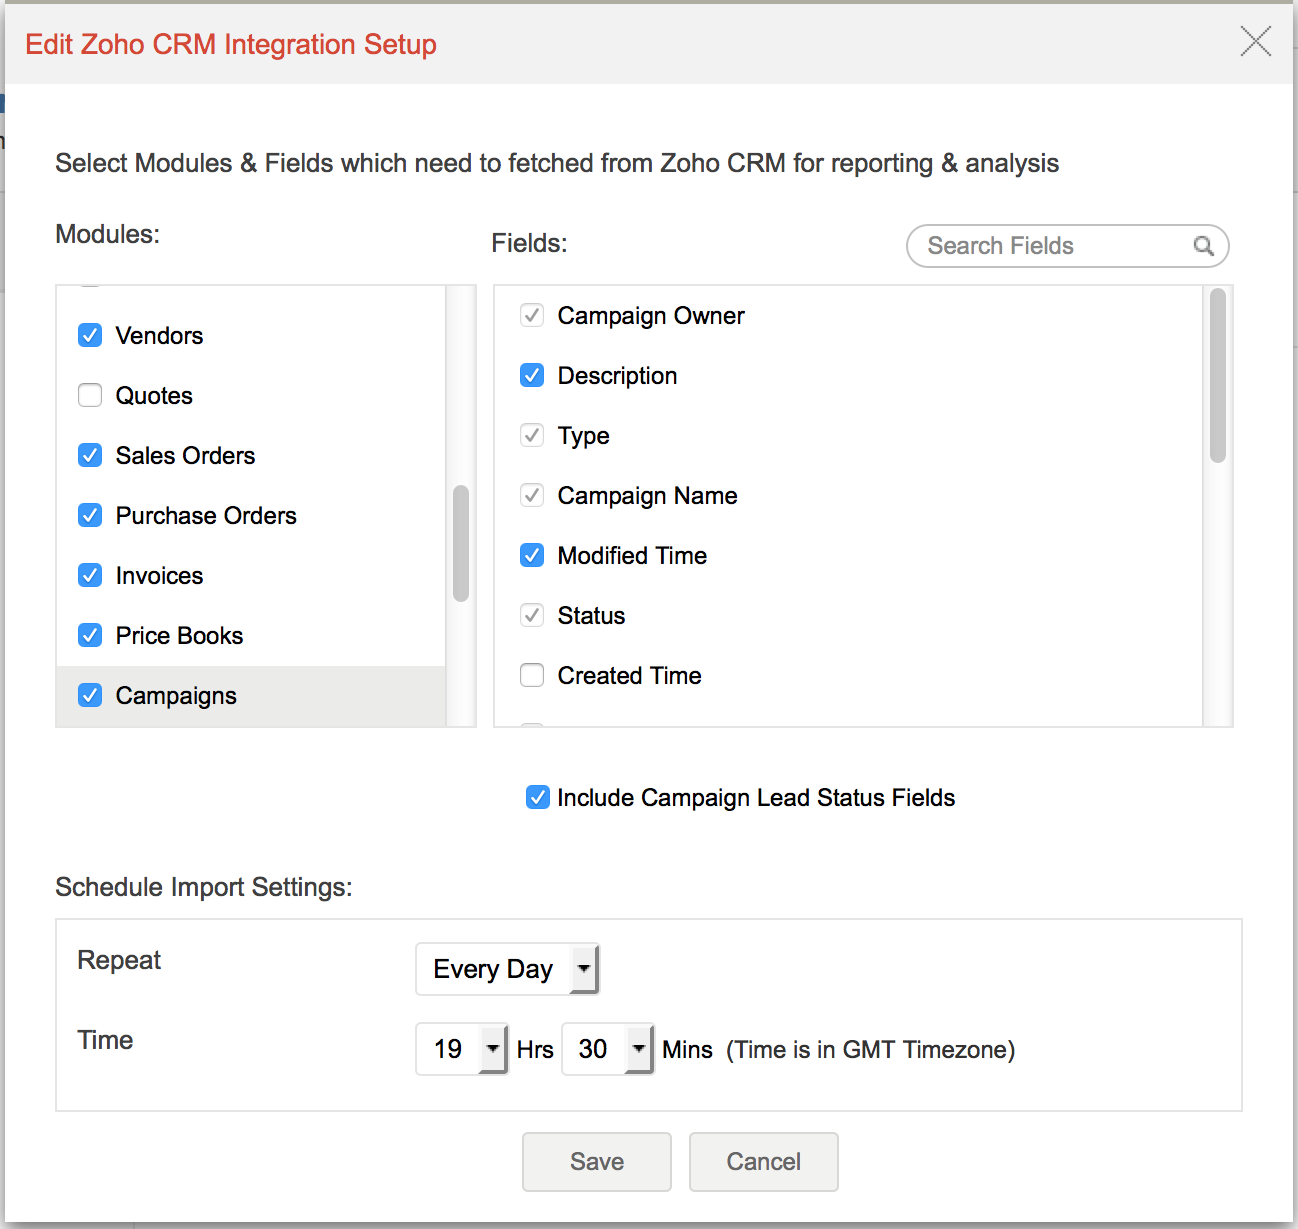
Refer to "Zoho Analytics Advanced Analytics Add-on for Zoho CRM" help documentation to know more about the default fields and formulas that will get synchronized for these modules on setup.
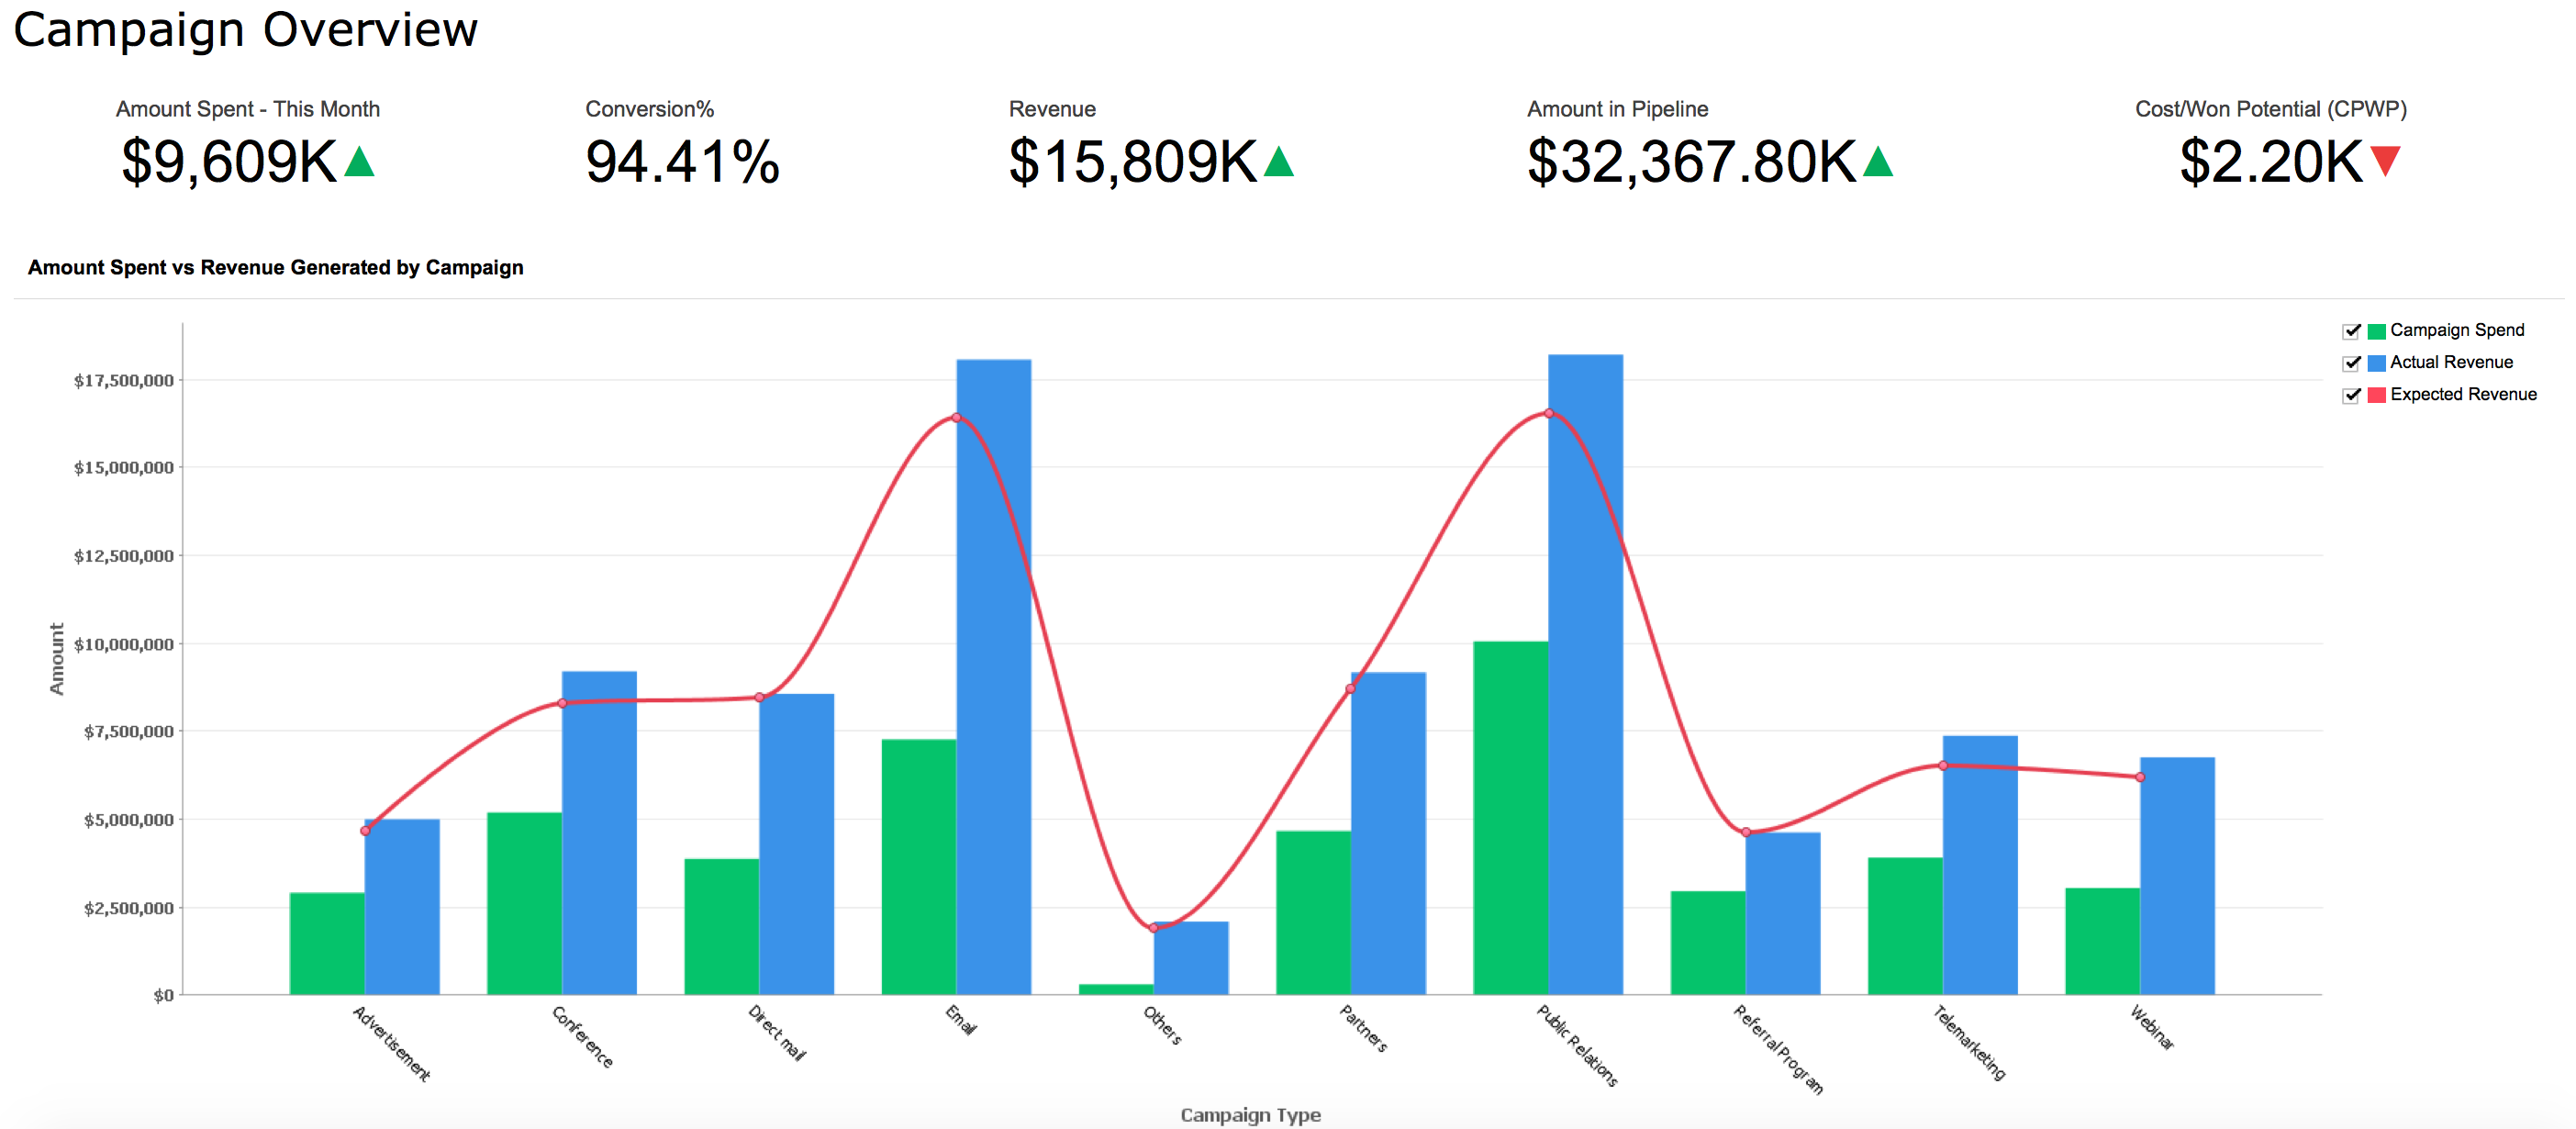
Feb
Feb 25, 2016
Schedule E-mails in your own Time Zone
Zoho Analytics now offers support to schedule emails in your preferred time zone. Previously only Greenwich Mean Time(GMT) was supported.
To schedule an email :
- Open the report/dashboard and click Email>Email this View.
- In the Email as : Settings window that opens, you can set your schedule preferences.
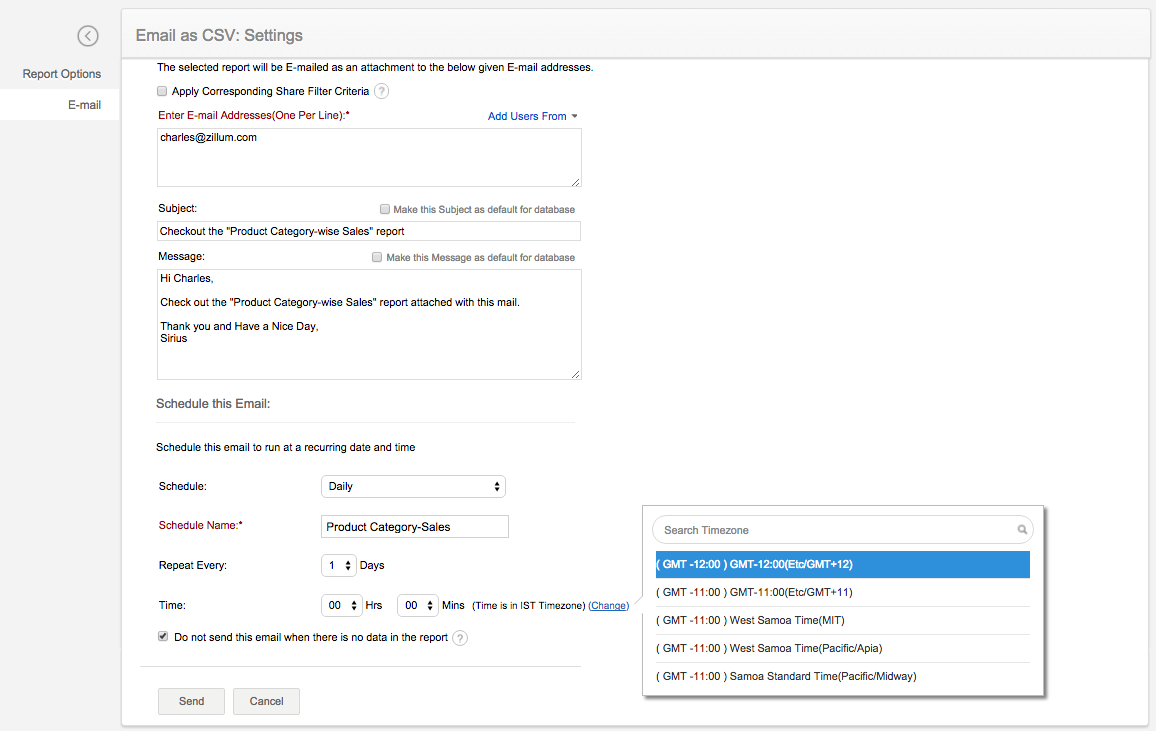
Jan
Jan. 5, 2016
Support to Export/Email Multiple Reports in a HTML Format
Zoho Analytics now supports exporting/emailing multiple reports in a HTML file format. So far these features were only available for a single report.
Now you can export or email multiple views as a single zipped HTML file by clicking Export -> Export Multiple Views -> As HTML (ZIP).
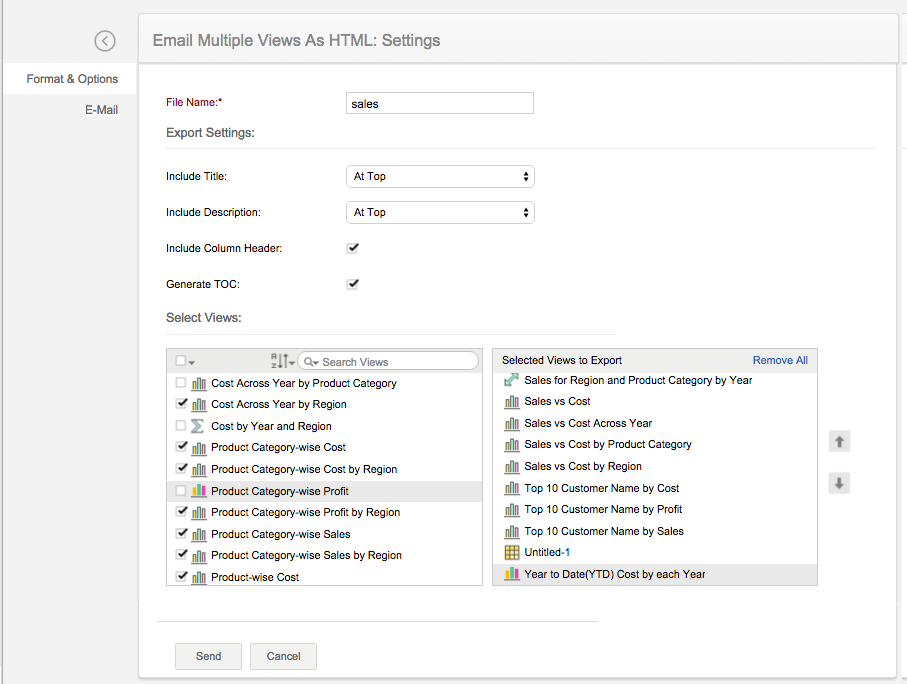
So far this multiple export feature was supported for PDF file format.
Check out updates in: 2017 | 2016 | 2015 | 2014 | 2013 | 2012 | 2011 | 2010 | 2009 | 2008 | 2007
Jan. 8, 2016
Show Involved Columns Option in Reports Designer
Recently there was an update to filter, sort or expand the fields in the reports designer. We have now additionally implemented an option to Show Involved Columns. This will be useful to quickly list only the data fields used in creating a particular report.
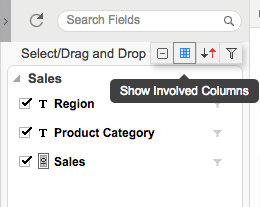
Share your Feedback with a Screenshot
We now allow you to take a screenshot of the issue you are facing and attach it, while sharing your valuable feedback to the Zoho Analytics team. This will help us serve you better. To use this feature click on Feedback link in the top right corner and select Capture Screen.
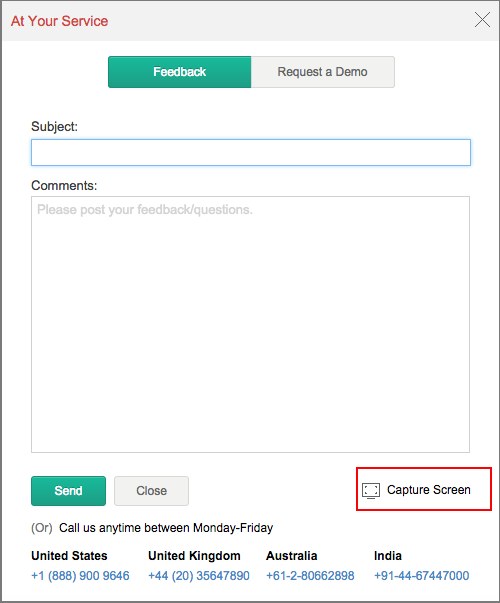
You can click to capture the entire screen or drag to select a section of the screen. With this feature you will be able to
- Zoom-in or Zoom out
- Highlight a particular section
- Blackout a section
2015
Dec
Dec. 22, 2015 | |
Enhancements in DashboardZoho Analytics Dashboard has been enhanced with the following feature. ThemesZoho Analytics now allows you to apply a range of visually appealing themes over your dashboard. By default Zoho Analytics provides six theme layout, which can also be customized as needed. You can choose the required theme by clicking theThemes toolbar option in the Dashboard. You can customize any theme by clicking the Customize option displayed when you mouse over the themes listed. The new themes support will definitely make your dashboards look really appealing. You will find it more handy in case of embedding as you can customize the dashboard to suit your website or application look & feel. 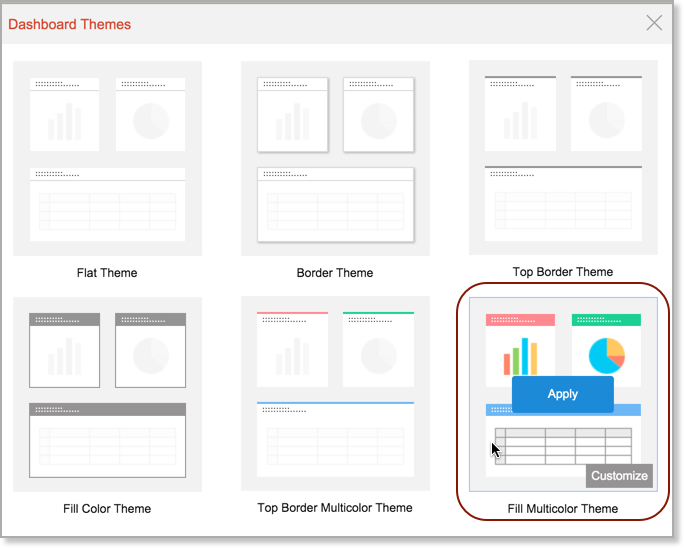
KPI Widget Color CustomizationNow Zoho Analytics allows you to customize the display color of the Primary value of the widget, when the value is lesser than zero or greater than or equal to zero.
Handy Contextual Options for ReportsZoho Analytics now provides a set of handy contextual options for reports embedded in Dashboard. With these new options that appears on mouse over, you will be able to perform the following operations.
The options will appear to a dashboard viewer/user based on ther permissions granted by the author of the dashboard.
Conditional Formatting for Pivot Table and Summary ViewZoho Analytics now provides Conditional Formatting support for Pivot Table and Summary View. This enables in visually highlight data points in your pivot & summary views, thereby enabling to do better and easy analysis.
To know how to apply conditional formatting over your Pivot, refer here. |
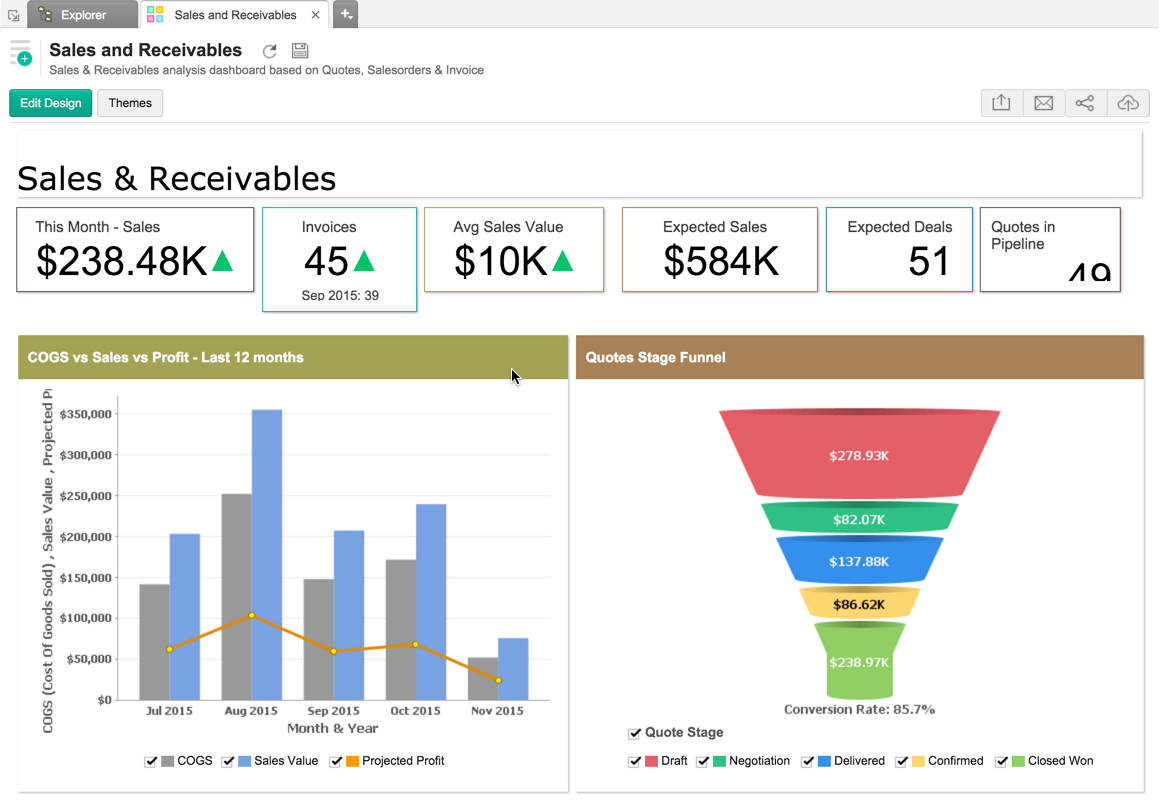
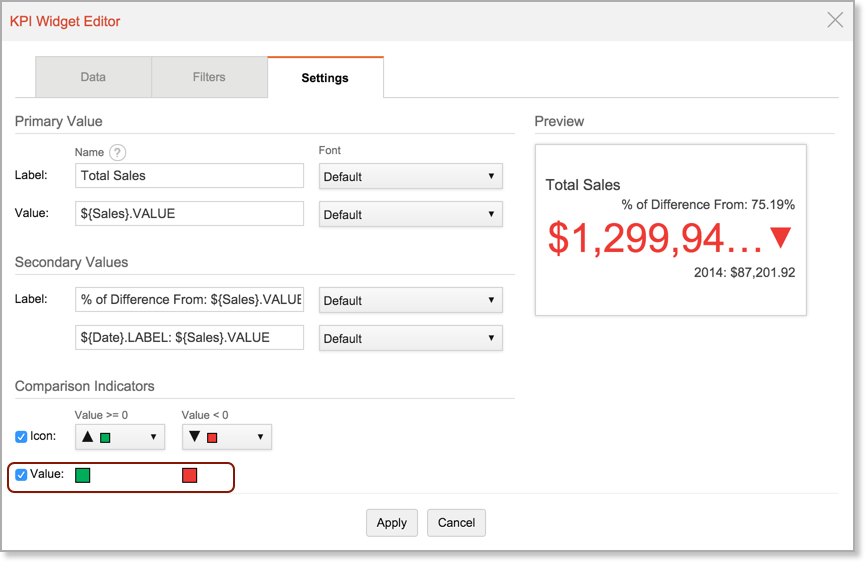
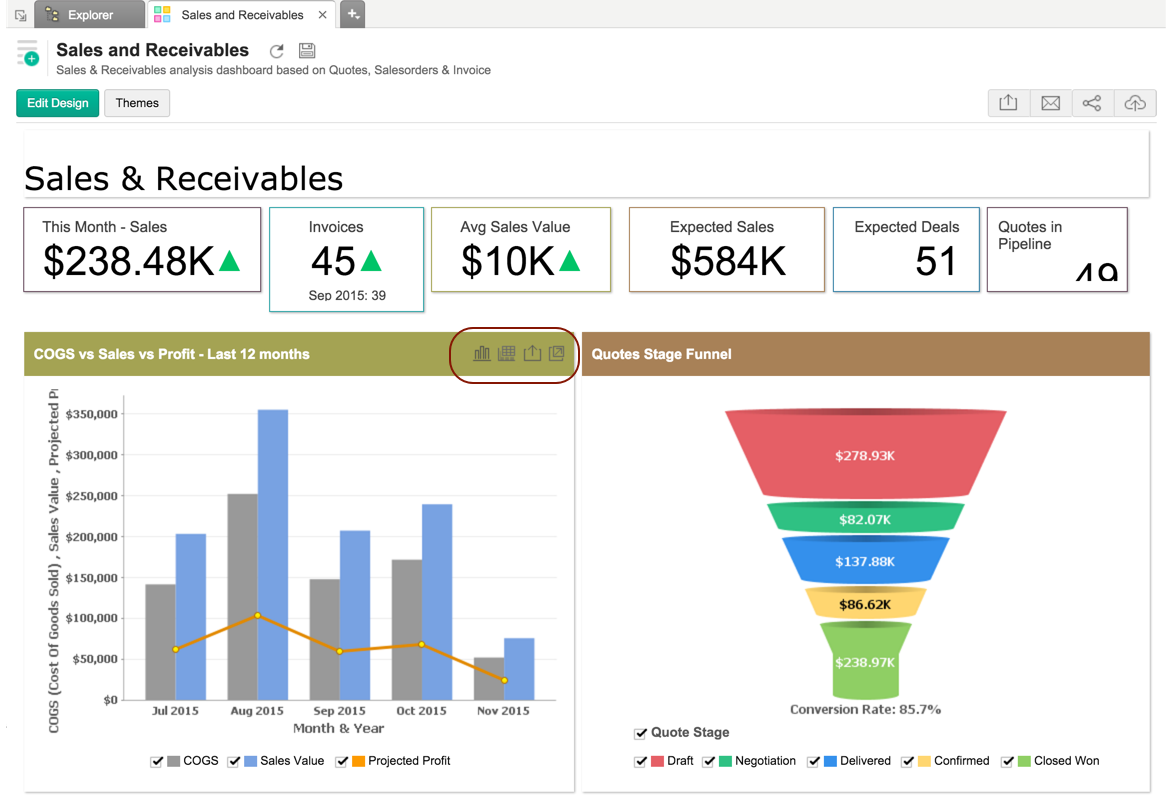
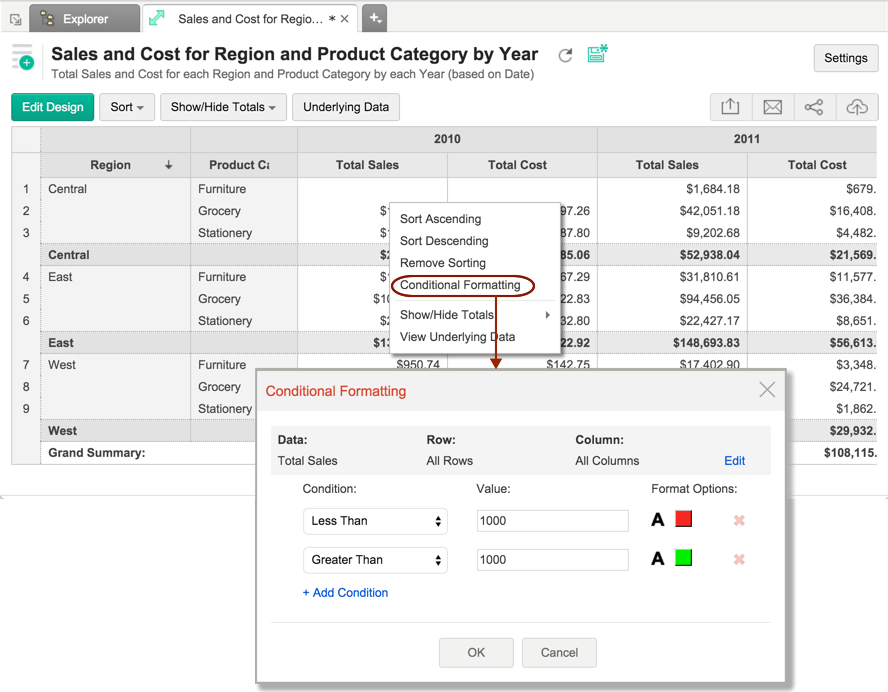
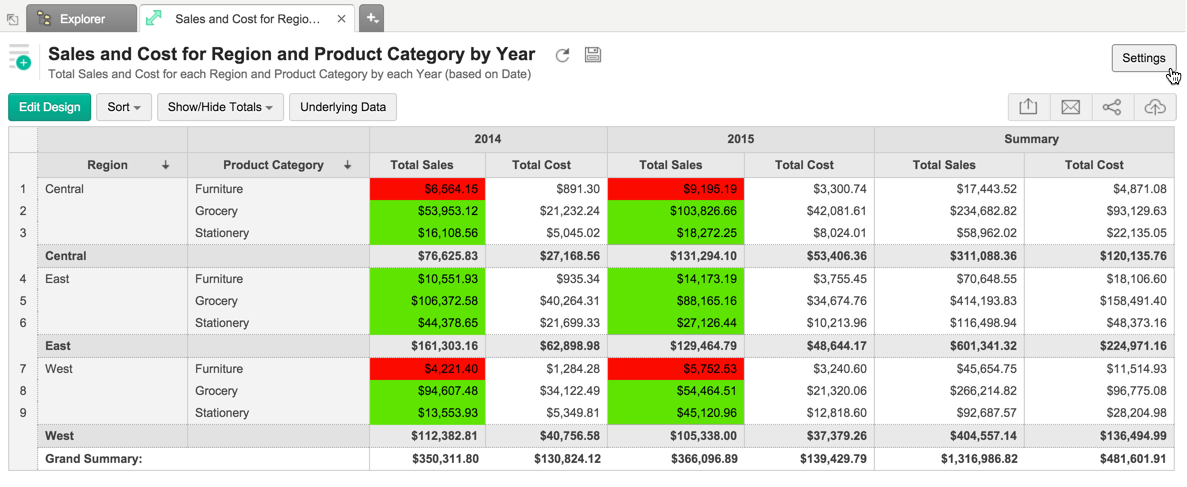
Nov
Nov. 30, 2015 | |
Enhancements in Query Table Editor Interface:We are introducing a new feature rich query table editor in this update. The salient features of our new query table editor are as follows.
Add Description for Aggregate/Custom Formula:You can now add descriptions for your Aggregate or Custom formulae. These will be pretty useful to add contextual notes about the formula you create.
Language Support for Zoho CRM Column NamesFrom now on, if you change the language in Zoho CRM, the column names in Zoho Analytics will automatically get updated after the next synchronization. Inventory Modules for Salesforce CRMWe now support Inventory modules like products, price books, quotes, orders and contracts in Salesforce CRM.
|
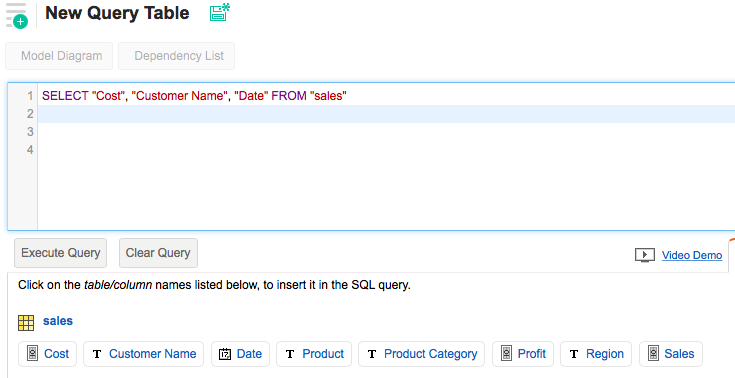
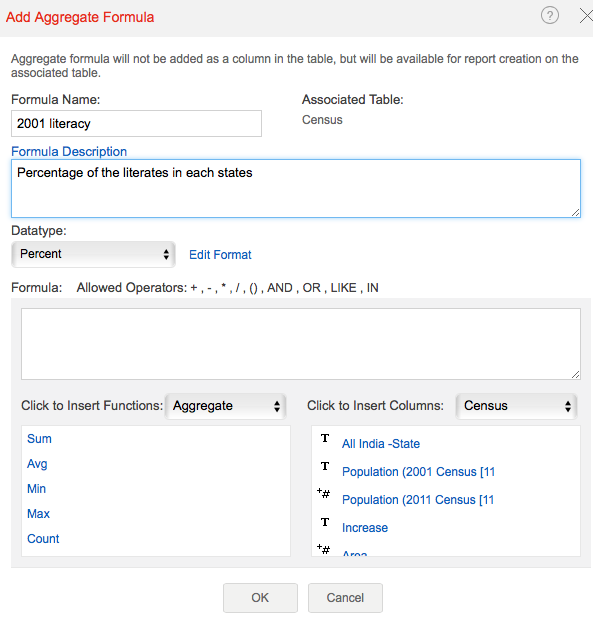
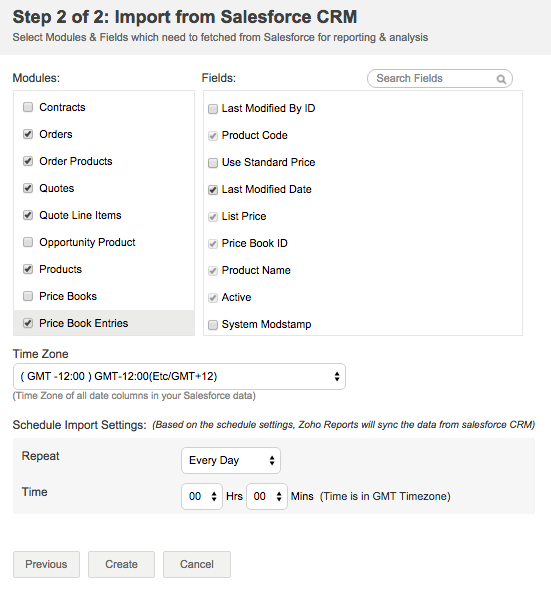
Oct
Oct. 1, 2015 | |
Support to Auto Format Units of a Numeric ColumnNow Zoho Analytics provides an option to auto format the unit value as thousand (K), million (M) and billion (B) based on the data in the corresponding column. Recently , Zoho Analytics introduced formatting the numeric columns values with thousands (K) or millions (M) or billion (B) unit notations. Now with this 'Auto' option, Zoho Analytics auto detects the data in each record and formats the unit accordingly. This allows the flexiblity of setting the right unit based on the actual value in each row, instead of fixing only particular unit always.
|
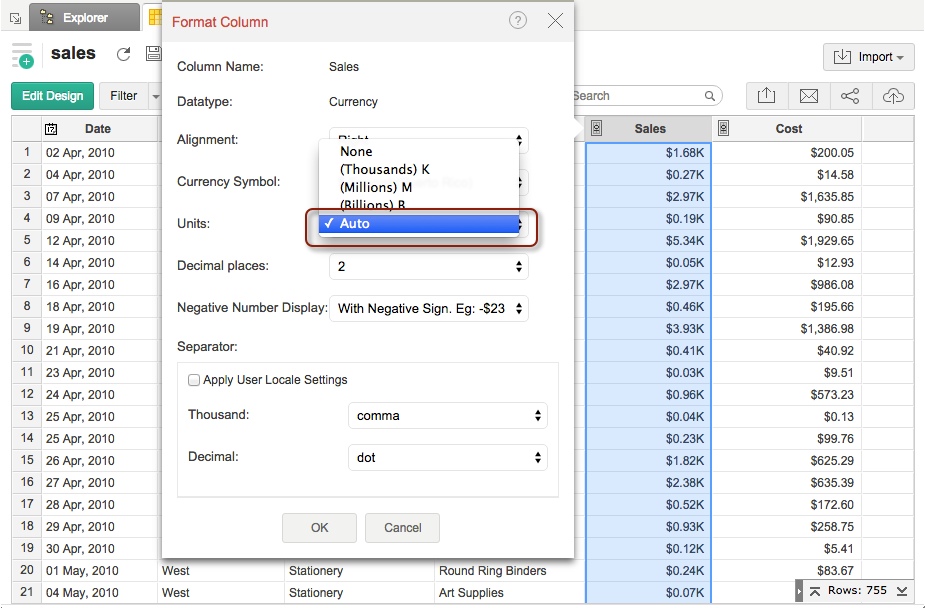
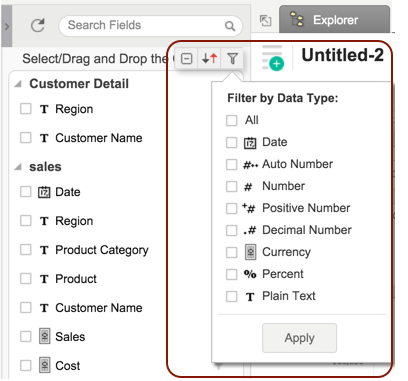
Sep
Sep. 9, 2015 | |
Multiple Groups Support for Sharing & CollaborationZoho Analytics now allows you to create multiple groups to share & collaborate easily in a Workspace. You can group a set of users based on functional roles/needs to create a group. Within this group you could easily share data, reports and dashboards to enable easy collaboration.
Email Reports and Views as In-line MailZoho Analytics now allows you to E-mail reports as a in-line mail content. So far reports can be mailed only as an attachment. Now they can be sent as part of the mail content, which will be very easy for users to view them.
Goal Module support in Google Analytics data connectorGoogle Analytics Advanced Reporting Add-on now supports syncing Goal data from Google Analytics into Zoho Analytics for reporting & analysis. Support for New FormulasWith this update the following formulas have been supported in Formula Columns.
|
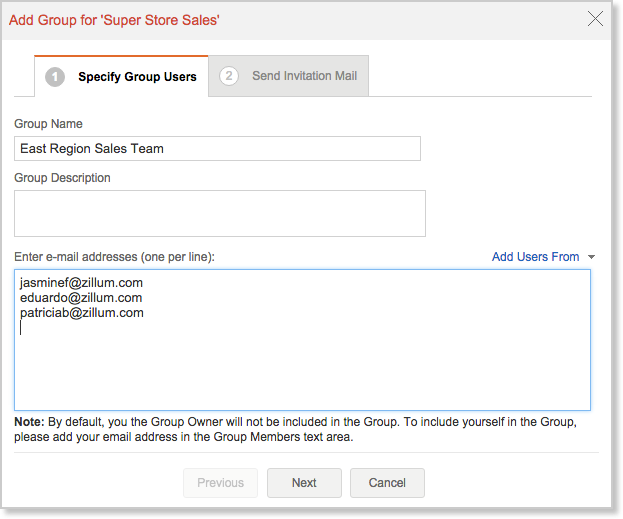
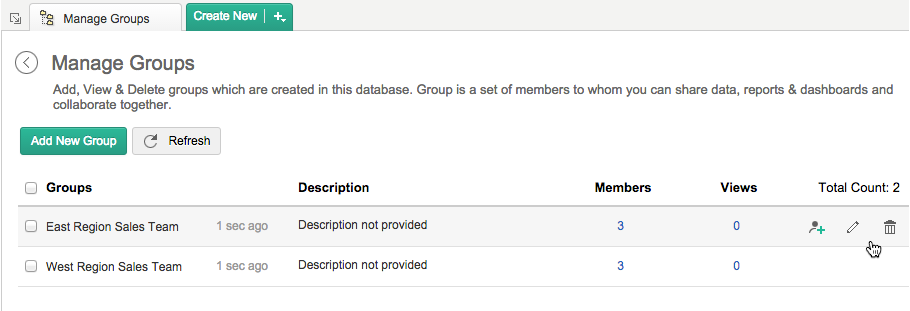
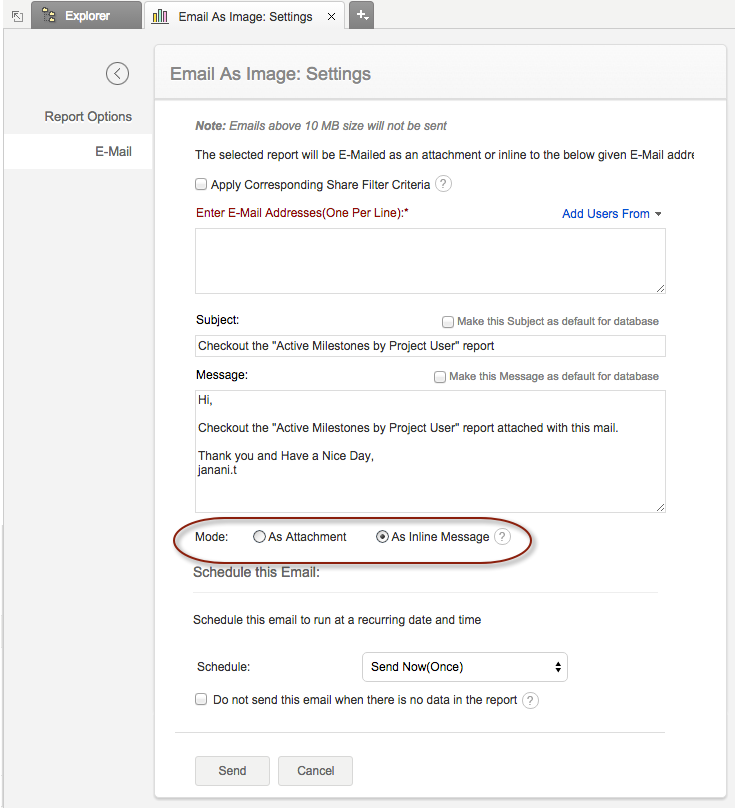
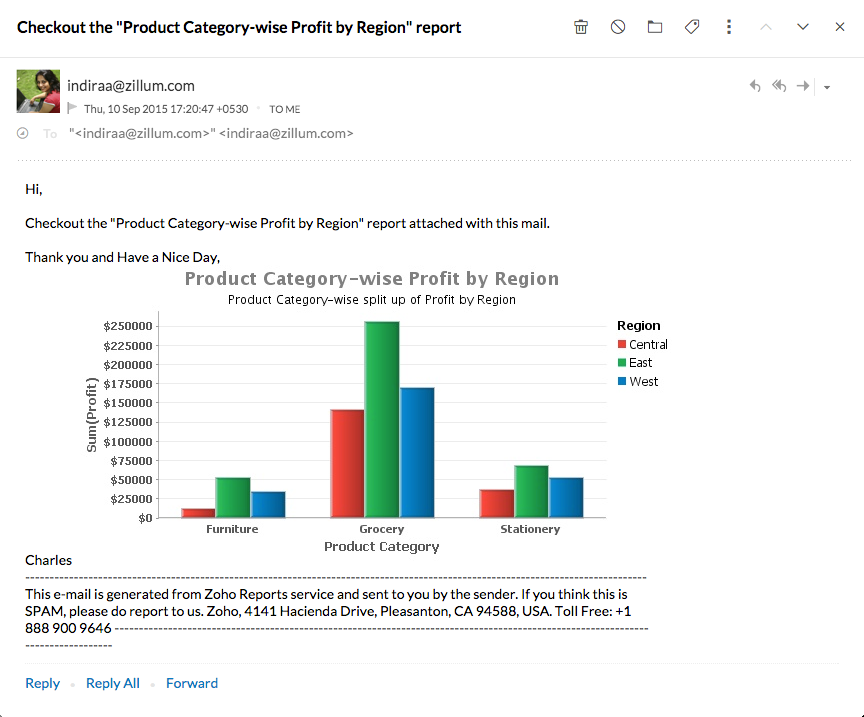
Sep. 11, 2015 | |
Enhanced Upload Tool - Upto 4 times fasterThe new version of Upload Tool supports executing multiple database queries in parallel, thus enabling quicker data uploads from your local databases. This version of upload tool can handle data uploads up to 4 times faster than the previous versions. The previous versions of Upload Tool will execute the database queries configured in database_sql_queries.xml one at a time, pulling data from your local database and uploading the same into Zoho Analytics. In the new version the tool smartly identifies dependencies between the queries configured and looks at parallelizing the execution. The tool considers the following cases as dependent queries:
For the above mentioned cases, queries will be executed sequentially one after the other based on dependency . In all other cases, where there are no dependencies, query execution will be done in parallel, thus enabling faster data uploads. You can download the latest version of the Upload Tool from here. |
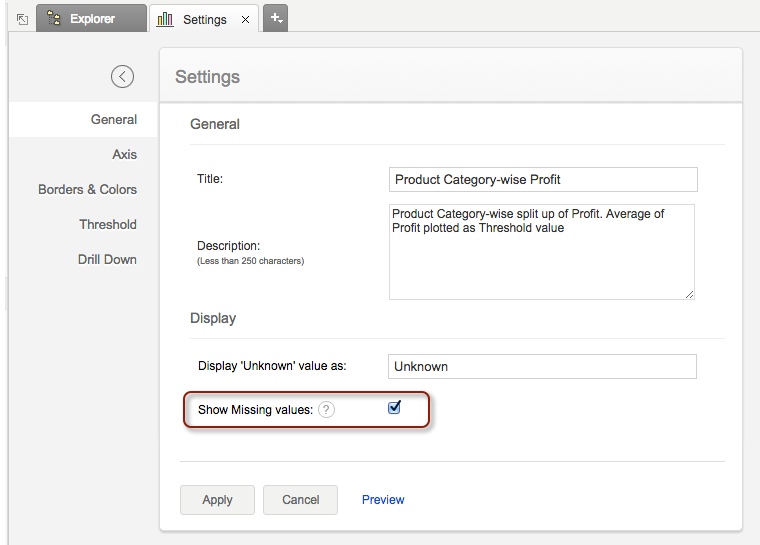
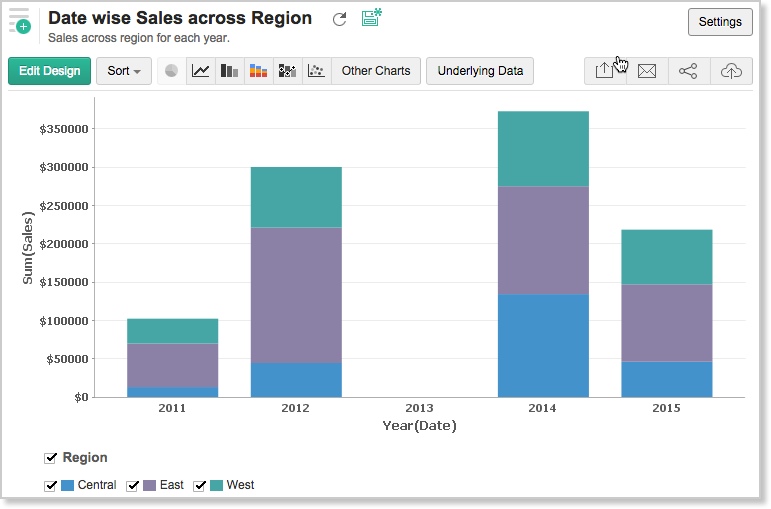
Aug
Aug. 6, 2015 | |
Chart specific Drill Down PathNow Zoho Analytics allows you to set a drill down path for your chart axis from within Charts settings. This enables you to define drill down paths a lot quicker for a chart. You can find this option in Settings section, which allows you to define the complete path in the same dialog. This path is specific to the chart where you are defining it.
When you open the Drill down settings, any drill paths paths already defined at the table level will be displayed by default. If you want to define the path globally (i.e., for all charts), then you need to define that for the corresponding columns at the table level. To know more refer this documentation.Create Lookup Columns in Business Application Data ConnectorsIn the databases that you setup using any of the default Business Application Data connectors (like Zoho CRM, Salesforce etc.,) offered by Zoho Analytics, till now you cannot define Lookup columns in the data tables pulled (synchronized) from these applications. Now we support this too. With this option you can combine data sets (using the auto-join feature) across business applications (e.g., combine Zoho CRM Leads data with your Marketing Campaign information that you might have stored Google Drive etc.) and easily do cross functional analytics. |
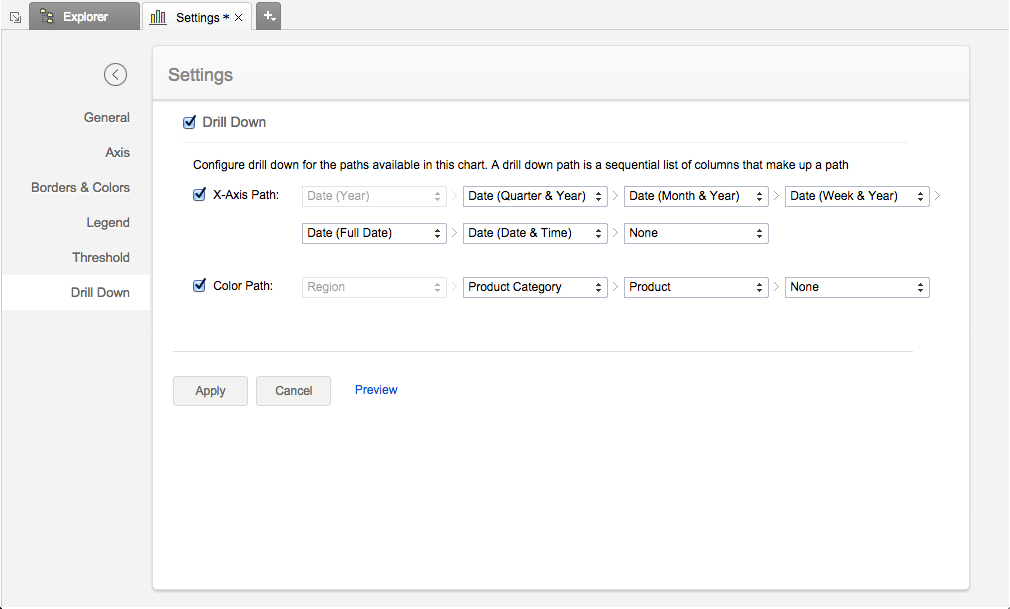
Aug. 13, 2015 | |
Android App Support for Zoho AnalyticsWe are happy to announce the availability of the Zoho Analytics App for Android Tablets. With this app you can access & interact with all your reports & dashboards in your Zoho Analytics account on the go any time, any where.
Groups & Clients Modules support in Zoho Projects and Zoho BugTracker Analytics Add-onThe Advanced Analytics Add-on for Zoho Projects and Zoho BugTracker now supports Groups and the Clients modules. From now on you can synchronize data from these two modules into Zoho Analytics and analyze the same.
|
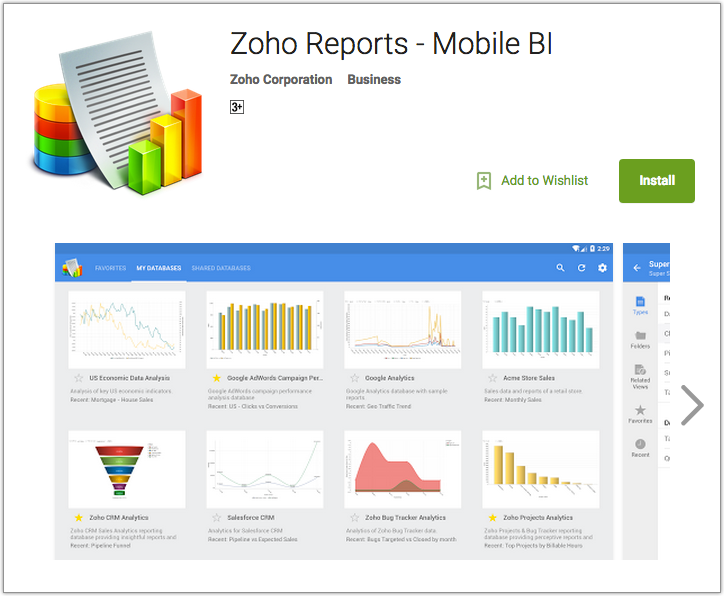
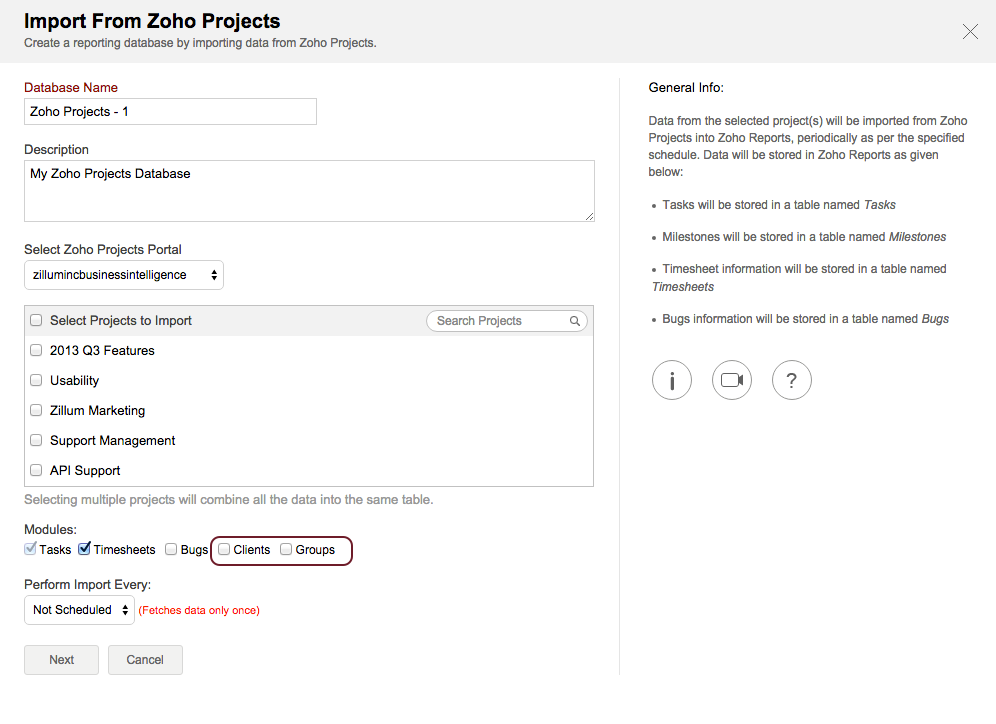
Aug. 24, 2015 | |
Enhancements in KPI WidgetsSupport to Customize the Comparison Indicator Now Zoho Analytics allows you to customize the comparison indicator. Till now the indicators will only be displayed based on the result of comparison between latest and previous value. From now on you will be able set the indicator by choosing what to compare with the given aggregate values. With this you can display the indicator based on various patterns such as comparison between maximum & minimum value and so on. You can also set the indicator by comparing it with a constant value.
Support to Customize the Primary Value With this update Zoho Analytics allows you to display dynamic values in the Label & Value component of the KPI widgets. You can do this by specifying the values in a parametrized format. Follow the below given format to specify a parametrized format. ${ColumnName}.LABEL - Refers to the default label of the column used. ${ColumnName}.VALUE - Refers to the corresponding functional value of the column used. ${OPERATION} - Refers to the corresponding Show Value As operation.
|
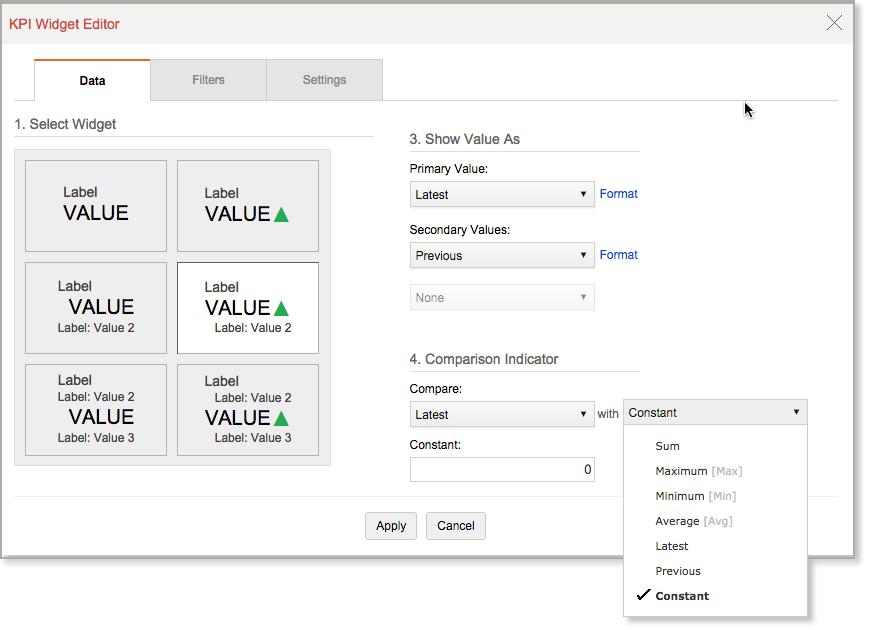

Jul
Jul. 24, 2015 | |
Report specific data formatting optionsZoho Analytics now allows you to set report specific formatting for data columns displayed in your reports. Till now you could set column formatting only in the Tables in which these columns are part of which was just inherited to every report that was created involving these columns. Hence it was not possible to change the formatting at the report level. The new reports specific formatting options addresses this limitation. You can set this using Setting section of the report you create. This feature is available for Charts, Pivot View and Summary View. In Charts this will format the data displayed as tooltip. The following screenshot is from a pivot table settings dialog.
Dashboard PDF Export EnhancementsZoho Analytics has now enhanced the dashboard PDF export with the following features. Zoom Factor in % (Font size)With this option, you can scale the font size of the reports in your dashboards to fit to the page size appropriately. This could be scaled between 1 to 100%. Column Width RatioThis allows you to define the column width radio for the table styles reports (pivot, summary, table etc.,) in your dashboard. You can either choose to have equal width for all columns or set proportional column width based on the design of the original report. Support for Custom Modules in Salesforce Advanced Analytics Add-onSalesforce Advanced Analytics Add-on now supports pulling data from custom modules setup in your Salesforce account into Zoho Analytics. You can add up to five custom modules from Salesforce into Zoho Analytics. Schedule Imports in your own Time ZoneSo far data imports can be scheduled only in GMT time zone. Now Zoho Analytics allows you to set these schedules in your own time zone of preference.
New Functions in Query TableZoho Analytics Query Table has now been enhanced with the following new functions.
|
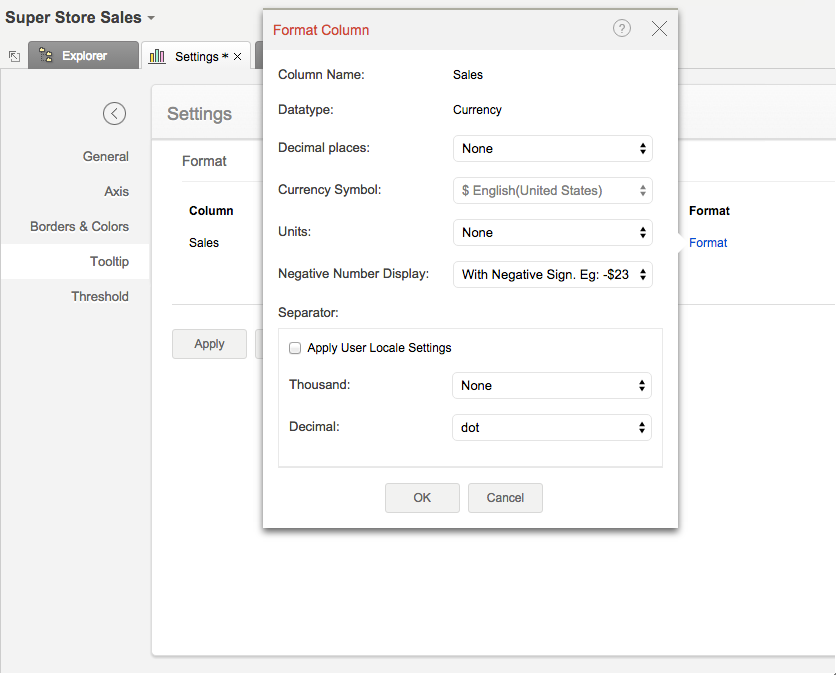
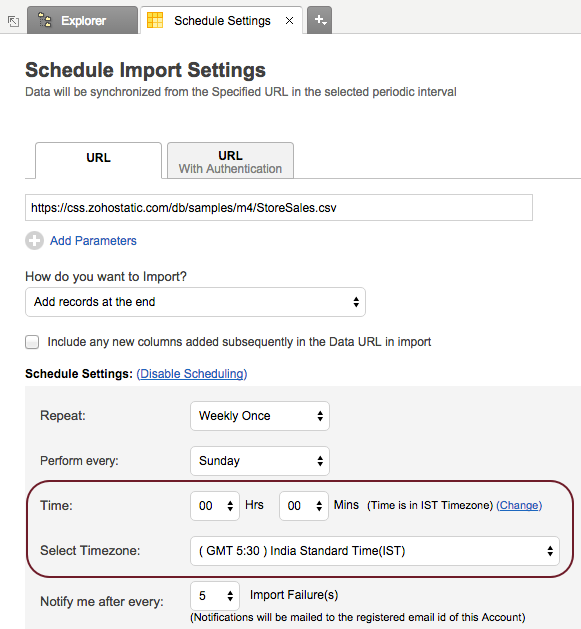
Jun
Jun. 5, 2015 | |
Trash and Restore SupportZoho Analytics now supports to the concept of trash and restore for better handling your deleted views in your Workspace. With this, you can easily restore views deleted accidentally from Trash. You can view all the deleted view list using the Trash option at the bottom left of your navigation tree. You can find the options to restore or delete the view permanently, when you mouse over the views listed under Trash. The views will be maintained in trash for 45 days from the date of deletion.
Support to Format Numeric Columns in UnitsNow Zoho Analytics supports formatting the numeric columns in units such as thousands (K), millions (M) and billion (B). This helps to maintain your data more legible as the value increases.
Dependency List of a Query TableZoho Analytics now provides an useful option to view the dependency list of any Query Table. With the "Dependency List" option you can view the parent tables ( & query tables) on which the selected Query Table has been created on. You can also view the list of child query tables which have been created over the selected Query Table. In the dependency list, you will also be able view the hierarchy level of each table (or query table) in the dependency list. Level indicates the proximity of the dependency. The lower the level the more direct is the dependency. Dependency list will be a pretty useful feature to facilitate easy management & maintenance of your query tables, especially if you are a power user of query tables.
Importing MilliSecond dataFrom now on you will be also able to import millisecond data into your date column in a Zoho Analytics table. |
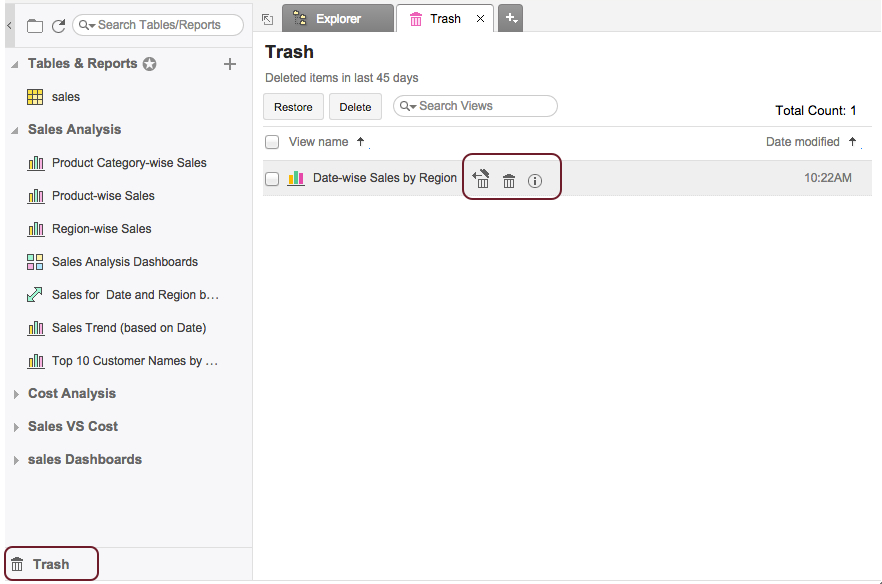
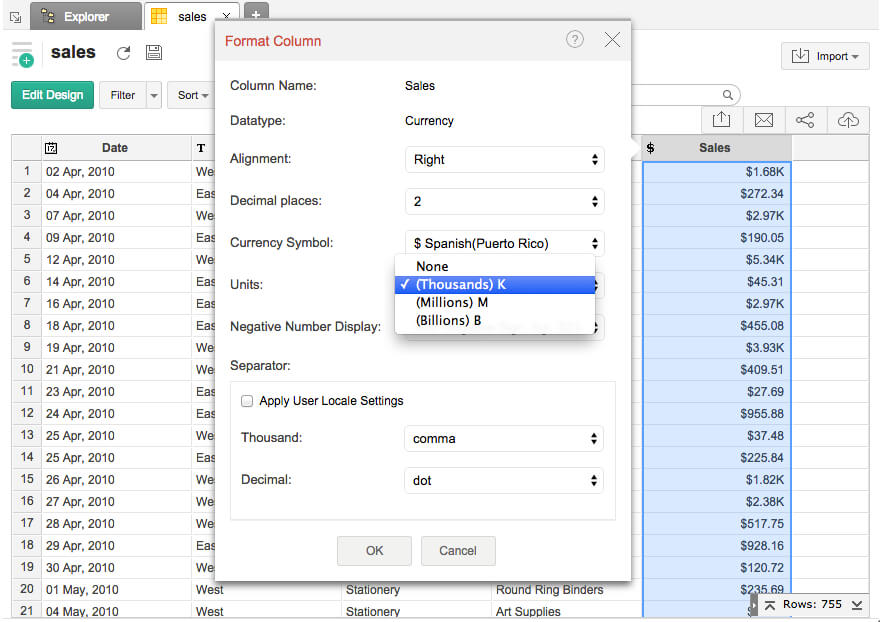
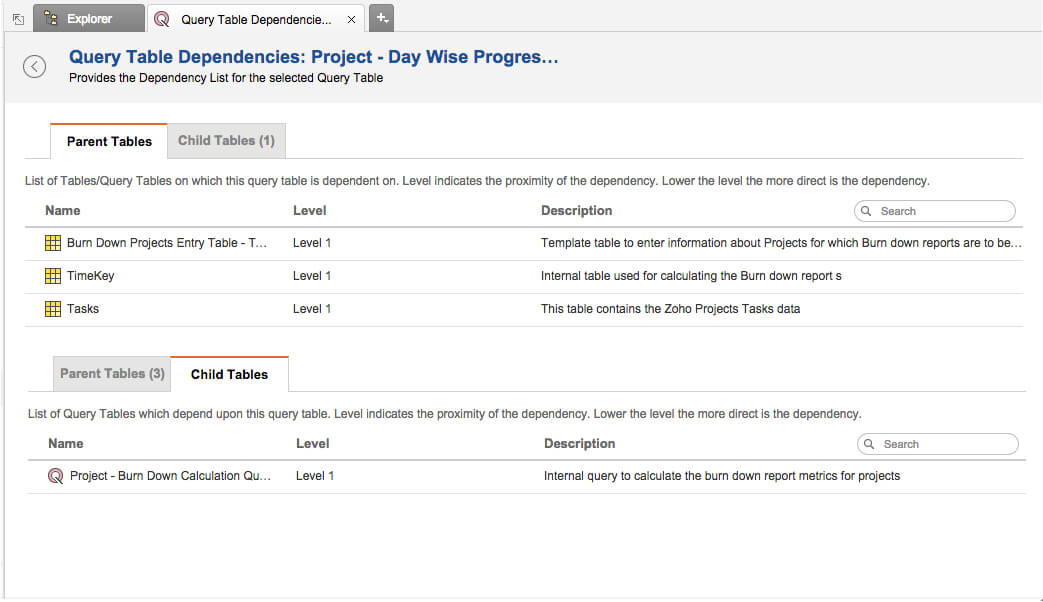
Jun. 23, 2015 | |
Custom Sorting in Pivot TablesZoho Analytics now allows you to sort the Pivot Table columns in a custom order that you define. Custom sorting was a feature that is already available in Charts, which has been extended to Pivot tables now. You can find the Custom Sort order item under the "Sort" menu in Pivot Tables. Invoking the same will allow you to customize the order in which the values of the columns are to be sorted. Setting the order and applying it will sort the column values accordingly.
Support for Date and Time Difference functionZoho Analytics now supports data and time difference functions in both Formula Columns and Query Tables. With this function you will be able to calculate the date and time difference between two date columns based on the unit specified. The supported units are SECOND, MINUTE, HOUR, DAY, WEEK, MONTH, QUARTER, YEAR. For more details refer here. Enhancement to Auto Generated ReportsAuto generated reports in Zoho Analytics has now been enhanced. With the new update you will find new combination of analysis done and reports created automatically. That apart now the reports generated also covers some the valuable features that has been recently introduced into the product. Do give it a try... |
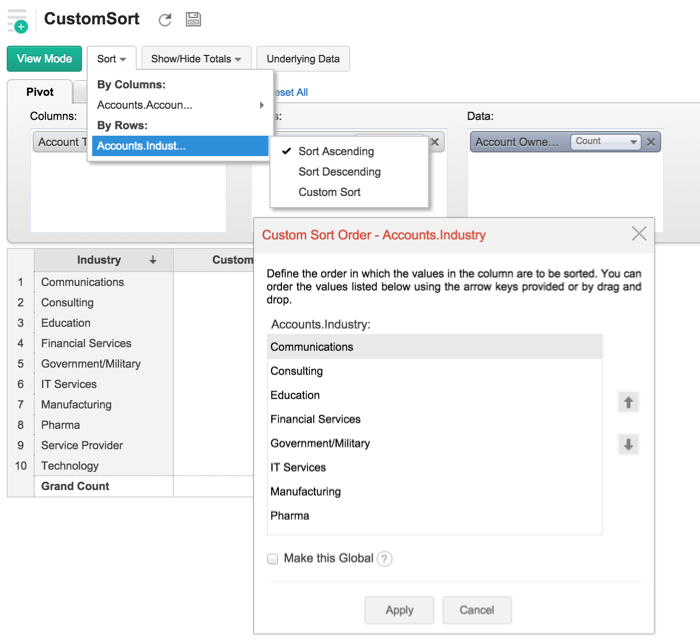
May
May 6, 2015 | |
Advanced Summary Functions support on Aggregate FormulaZoho Analytics now supports applying Advanced Summary Functions (Windowing functions) even over Aggregate Formula while creating reports. So far when you use an Aggregate formula in a report, you will not be able to apply other functions on the formulae. The function will always be selected as 'Actual' and cannot be modified. Now you can apply other windowing calculation such as Running Total, Difference form, Moving Calculation etc.,
|
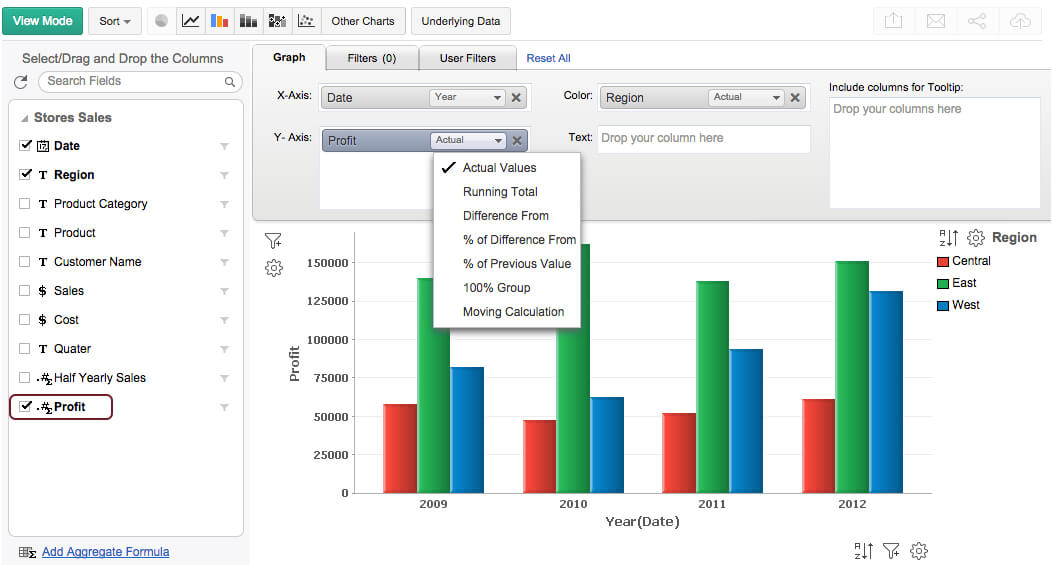
May 26, 2015 | |
Support for Inventory Modules in Advanced Analytics for Zoho CRMAdvanced Analytics Add-on for Zoho CRM now supports analytics on inventory modules data. With this, you can configure to synchronize data from the following inventory modules into Zoho Analytics Workspace while setting up the add-on.
Existing users can synchronize the newly supported modules by editing & saving the setup again. You can edit the setup either from Zoho CRM or Zoho Analytics. You can choose to include or exclude the line items (for quotes, invoice, sales order and purchase order) using the Include (module name) Line Items Fields checkbox in. For more details on how to edit setup, refer here. |
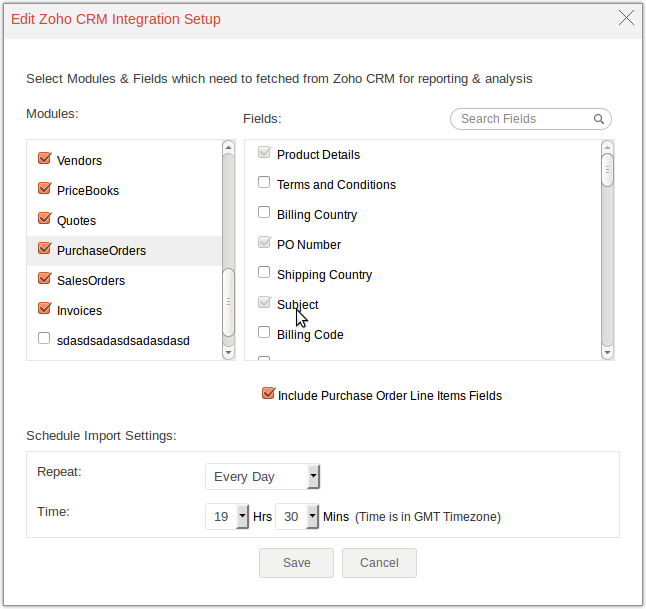

Mar
Mar. 26, 2015 | |
Configurable Join support for report creationZoho Analytics now allows you to choose between Left or Right type join while creating reports (Charts, Pivot Table and Summary View) over related (linked) tables. This option will provide much more flexibility in creating reports. You can find this option in the Table Relationship dialog.
Let's say you have joined Employees (parent table) and Tasks Completed (child) tables through a Lookup column Employee Name. If you want to create a report to show the tasks completed by each employee. Left join will return all employees who have 1 or more completed tasks in their name. 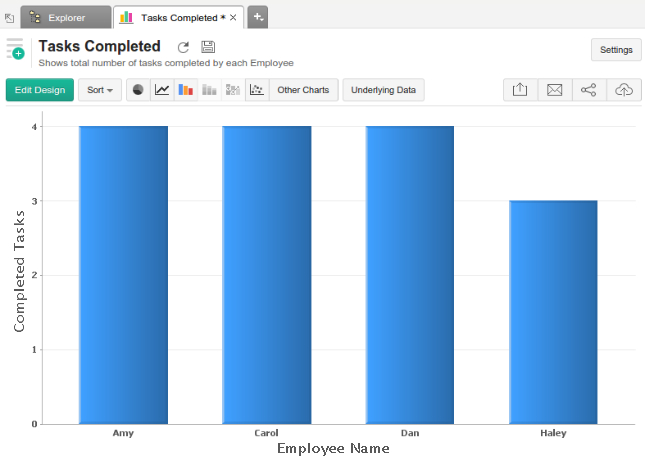 Where as Right join will return all employees, including those with no completed tasks at all.
|
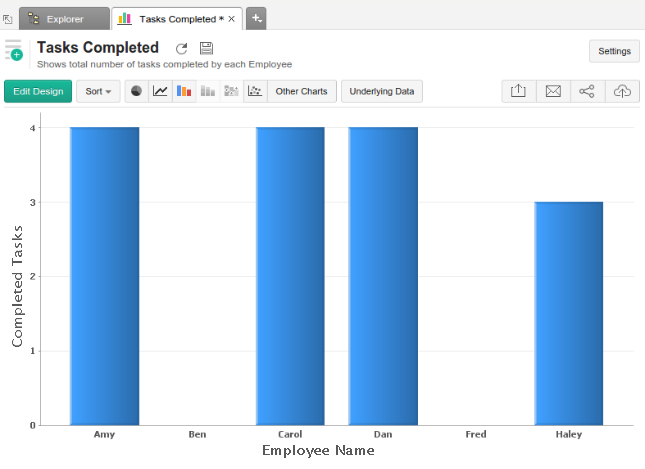
Jan
Jan. 02, 2015 | |
Copying a TableWith this new feature from Zoho Analytics, you can now save a copy of a table in your database. This feature will be pretty useful for cases like Backup, Copying table design etc. Click 'Save as' menu in the toolbar to save a copy of that table. You can choose to copy the table with data and/or retain the look up columns of the original table. On copying, all formatting, formulas etc. will get retained in the new table.
|
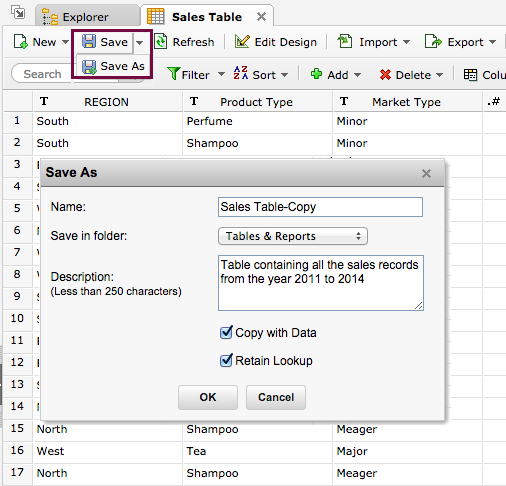
Check out updates in: 2017 | 2016 | 2015 | 2014 | 2013 | 2012 | 2011 | 2010 | 2009 | 2008 | 2007
Jan. 12, 2015 | |
Announcing Zoho Analytics 3.0The much awaited Zoho Analytics 3.0 is now here. Zoho Analytics 3.0 is sleek, responsive and feature-packed. The user interface has been completely revamped. Zoho Analytics 3.0 offers an enhanced user experience, designed for power users and beginners alike, to quickly and easily create fabulous reports. New data connectors for popular business applications including Salesforce, Google Analytics & ManageEngine ServiceDesk Plus have been added to the existing robust set of data connectors. Apart from the above, Zoho Analytics 3.0 comes with lot other interesting features like exploratory drill down, KPI Widgets in dashboards, organizing and sharing reports as Slideshows, visualizing and understanding your database models through Model diagrams etc. Watch the video below to find out what's new in Zoho Analytics 3.0. |
2014
Dec
Dec. 03, 2014 | |
Dashboards - Enhancement to View Underlying Data permission controlWhile sharing a dashboard for the permission "View Underlying Data" you could now handpick the columns specifically that you want to share. So far you could only show all the columns or the columns involved in the reports embedded in the dashboard.
|
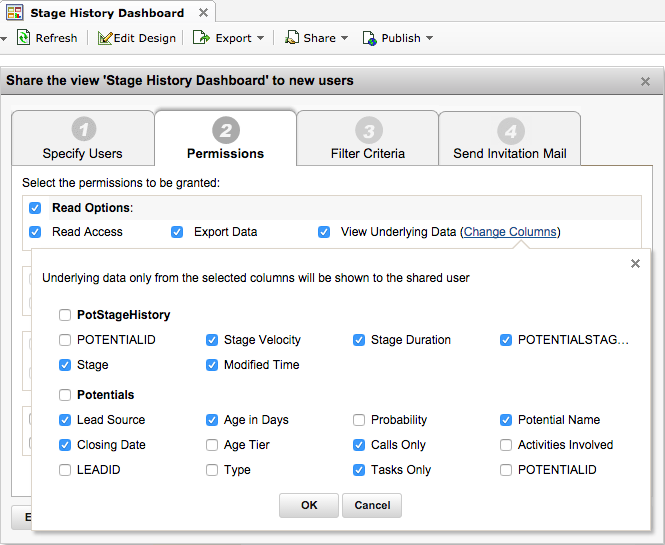
Dec. 08, 2014 | |
Conversion rate in Funnel Charts
Find the above features under 'settings' in chart view.
| |
Chart Enhancements
|

Dec. 10, 2014 | |
Advanced Analytics Add-on for ServiceDesk PlusZoho Analytics now provides an advanced analytics add-on for ManageEngine ServiceDesk Plus. With this add-on, SDP customers can create fine-grained reports with easy drag-and-drop actions, without writing database queries. The add-on also comes pre-packed with 80+ useful reports and dashboards. With this add-on you get simplified KPI tracking and analytics for improved decision support in IT service desk operations. |
Nov
Nov. 10, 2014 | |
Multi table support in Aggregate FormulaSo far, aggregate formula could be created with columns only from a single table. But now, you can create an aggregate formula by combining columns from any number of related tables. This will further help you to derive more powerful business metrics in Zoho Analytics. |
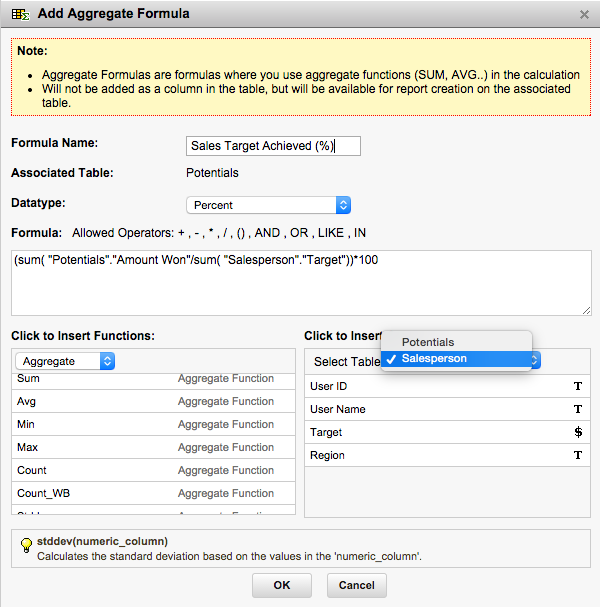
Nov. 20, 2014 | |
Editable User FilterSo far in User filters multiple values could be selected only from the drop-down box. But now, you can also enter the values separated by commas in the highlighted field. Values are case-sensitive and should exactly match the phrase. This feature is enabled only with 'Multi-select box component' in user filters.
|
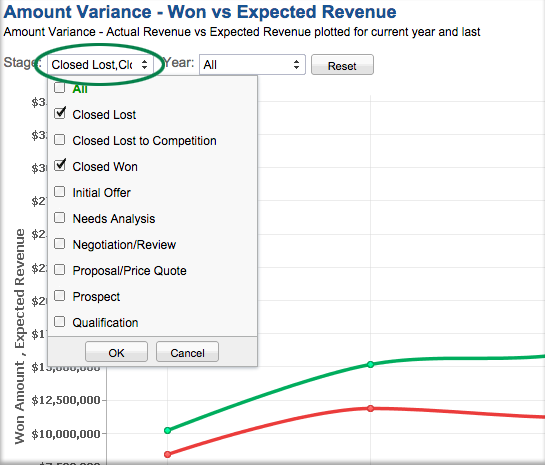
Oct
Oct. 14, 2014 | |
Setting on how to display Null/Empty values in reportsZoho Analytics now provides an option to specify how to display null/empty values in your reports. |
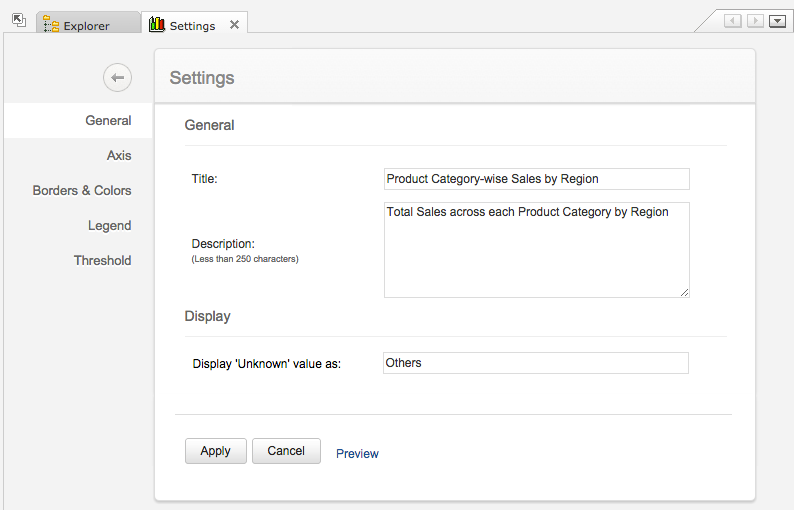
Oct. 24, 2014 | |
Support to Select a Range of Filter ValuesNow Zoho Analytics allows you to select or unselect a range of filter values using the Shift and click. This will reduce the tedious work of selecting the individual filter values and allows you to select multiple values together. This option is available for Filters and User Filters with Actual Values. |
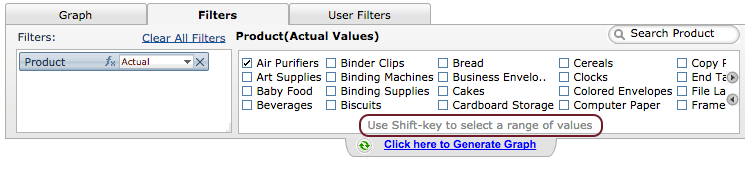
Sep
Sept. 2, 2014 | |
Support to Auto Refresh Published and Embedded ViewsZoho Analytics now provides an auto refresh option for the view that you embed or share as Permalink. Now you can set your views to automatically refresh at every N seconds to show latest data. 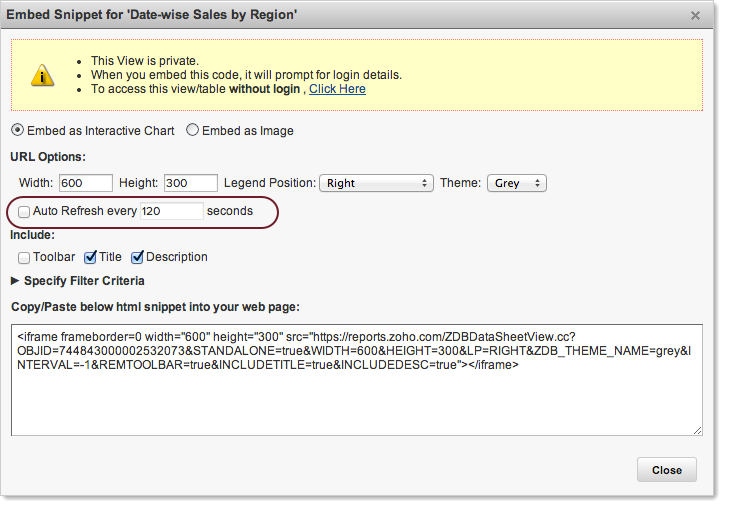 | |
Enhancement in Charts Custom Sort OptionNow Zoho Analytics provides delete option in Charts custom sort dialog to remove the values that are no longer available in the underlying data.
|
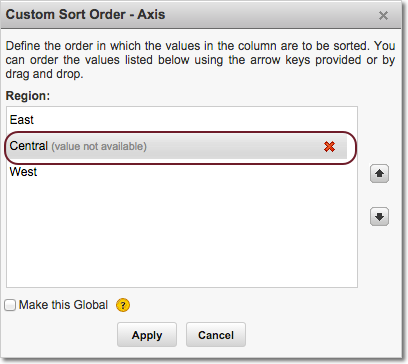
Sept. 9, 2014 | |
Zoho Analytics Analytics Connector for Salesforce CRMZoho Analytics now provides a connector add-on for Salesforce CRM. Using this, Salesforce users can now 'slice and dice' their CRM data and take informed business decisions. | |
Importing DataSetting up this add-on will sync data from your Salesforce account into Zoho Analytics. Data from the following modules, for which you have read permission, will be imported and stored in tables in Zoho Analytics.
| |
100+ Useful Default ReportsAlong with the Connector Add-on you will get 100+ insightful reports & dashboards. You can always customize them to your needs.
| |
Creating your own reportsYou could also create your own custom reports over the Salesforce CRM data easily using the drag & drop interface in Zoho Analytics. You can combine other dataset along with Salesforce CRM data for creating compelling & holistic reports by importing them into Zoho Analytics. For more details on Zoho Analytics Connector Add-on for Salesforce CRM, refer to Help link.
|
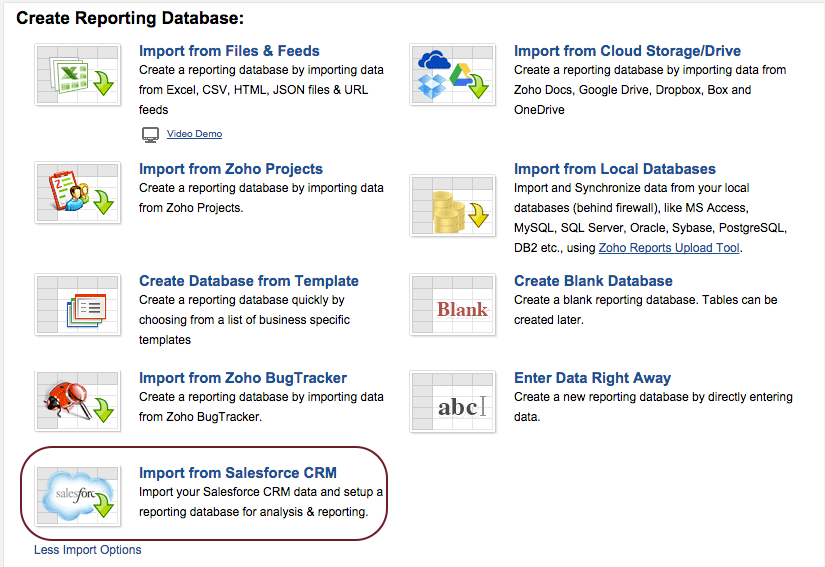
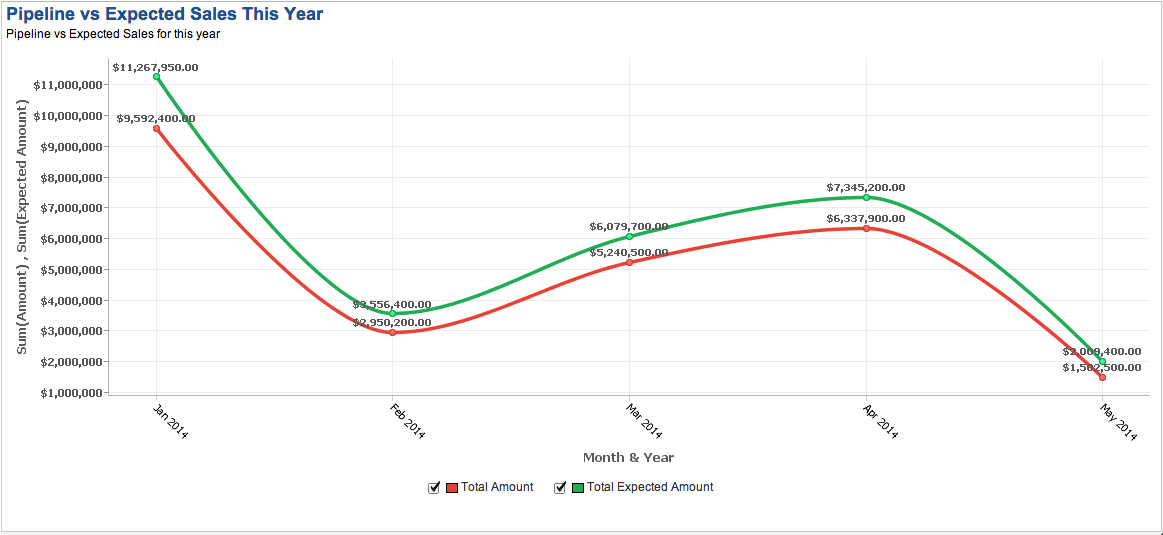
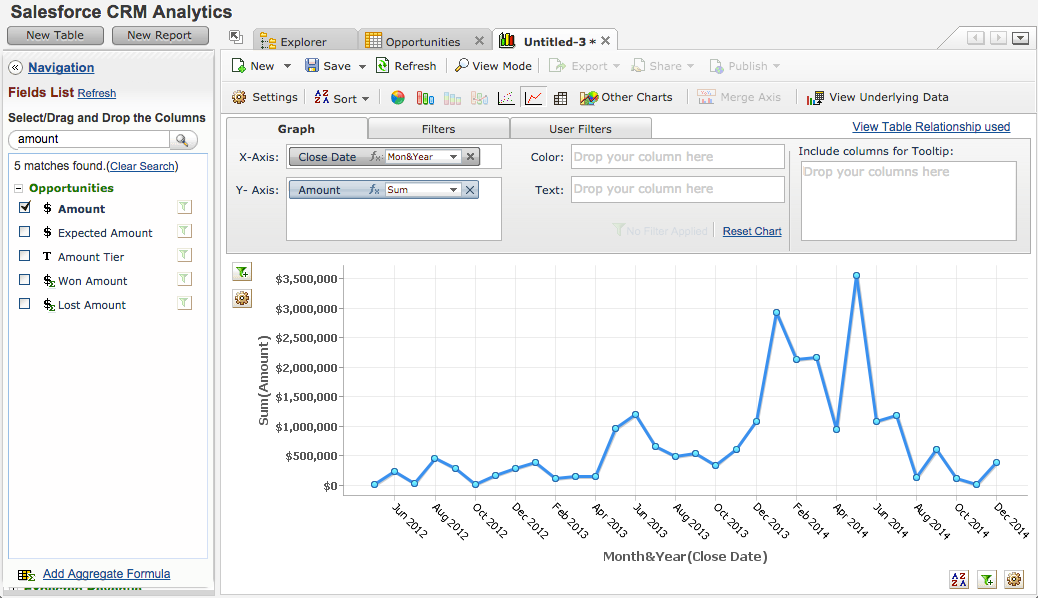
Sept. 17, 2014 | |
Enhancement in User Filters Component OptionNow Zoho Analytics provides an option to choose between a single select or a multi select drop down list for displaying date related values. Until now date user filter values for Actual, Relative and Seasonal period can be listed only in a multi select drop down list. Now you have the option to choose between single or multi select list box as required.
| |
Enhancement for Advanced Analytics Add-on for Zoho CRMAdvanced Analytics Add-on for Zoho CRM now supports analysing your Potential Stage History. You can avail this by selecting the Include Potential Stage History fields checkbox when you setup the Advanced Analytics Add-on. The Potential Stage History data will be added as a new table in Zoho Analytics Workspace.
| |
Support to Import XML FormatZoho Analytics now supports importing data from one more important file format, the XML. You can do this by setting the File Type as XML and then upload the XML data in the Import Wizard.
| |
Support to Set Parameters for Web URL while Importing Dataorts New 3.0 Interface (which is currently in beta) now provides an option to set Get or Post parameters for the Web URL from which you are importing data. You can set up to 20 parameters for your import URL.
|
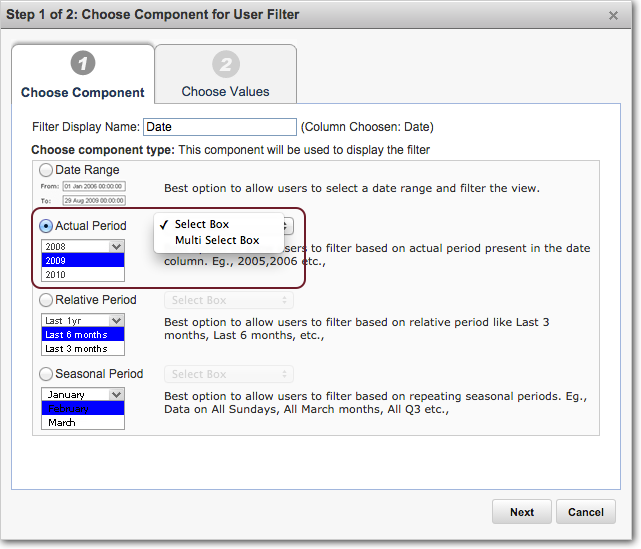
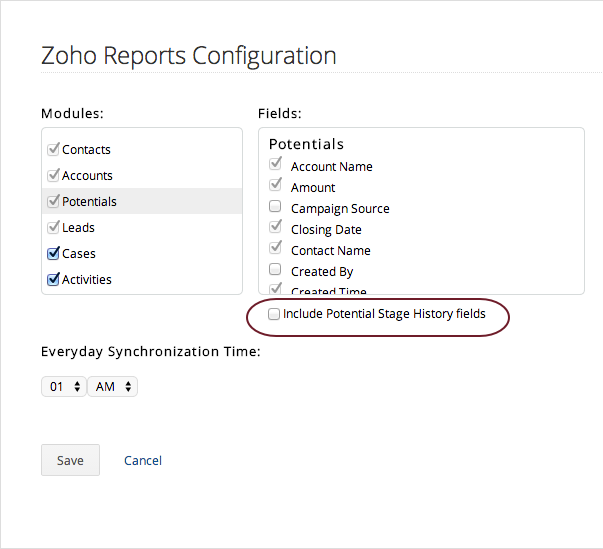
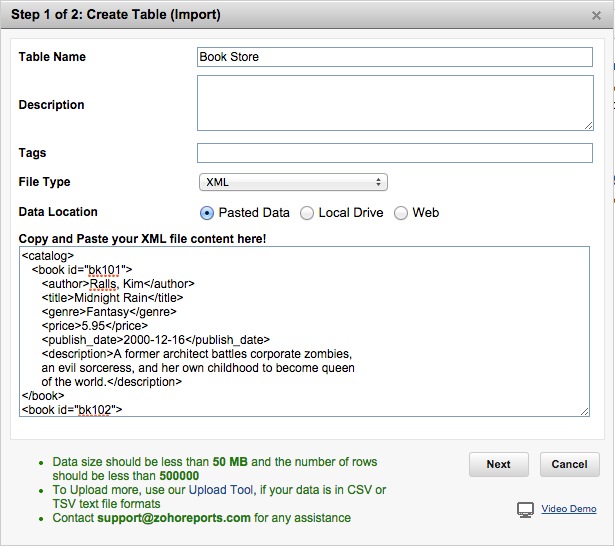
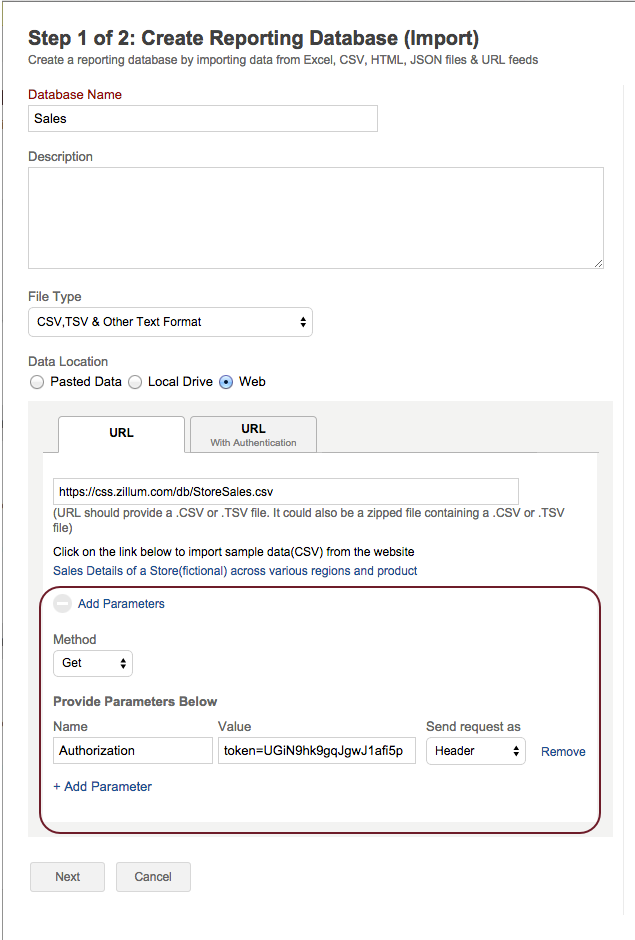
Aug
Aug. 25, 2014 | |||
Zoho Bugtracker Advanced Analytics Add-onThe Zoho Bugtracker Advanced Analytics Add-on is now available in the service. With this add-on, Zoho Bugtracker users can slice & dice their bugs data to effectively analyze & track their issue management projects.
| |||
Importing DataSetting up this add-on will sync data from your Zoho Bugtracker portals into Zoho Analytics.
| |||
50+ Useful Default ReportsAlong with the Connector Add-on you will get 50+ insightful reports & dashboards. You can always customize them to your needs.
| |||
Creating your own reportsYou could also create your own custom reports over the bugs information easily using the drag and drop interface in Zoho Analytics.
| |||
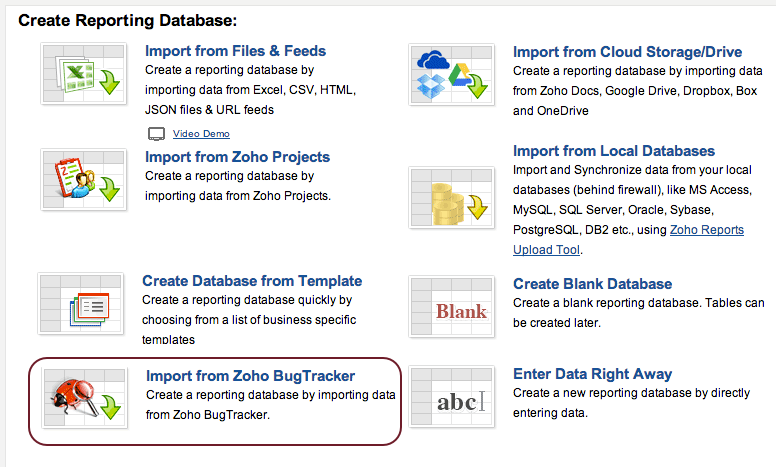
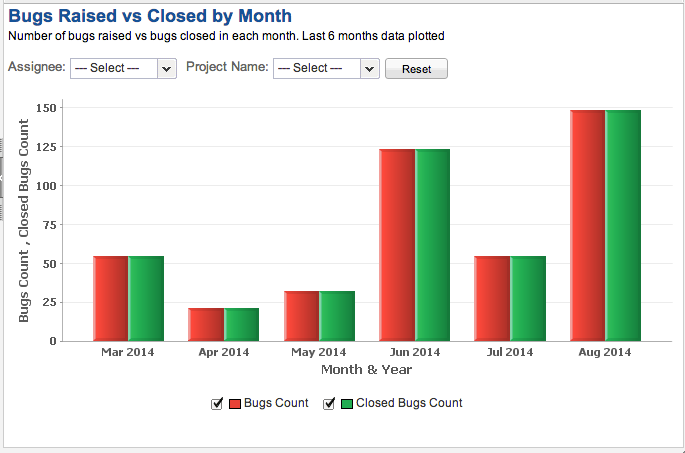
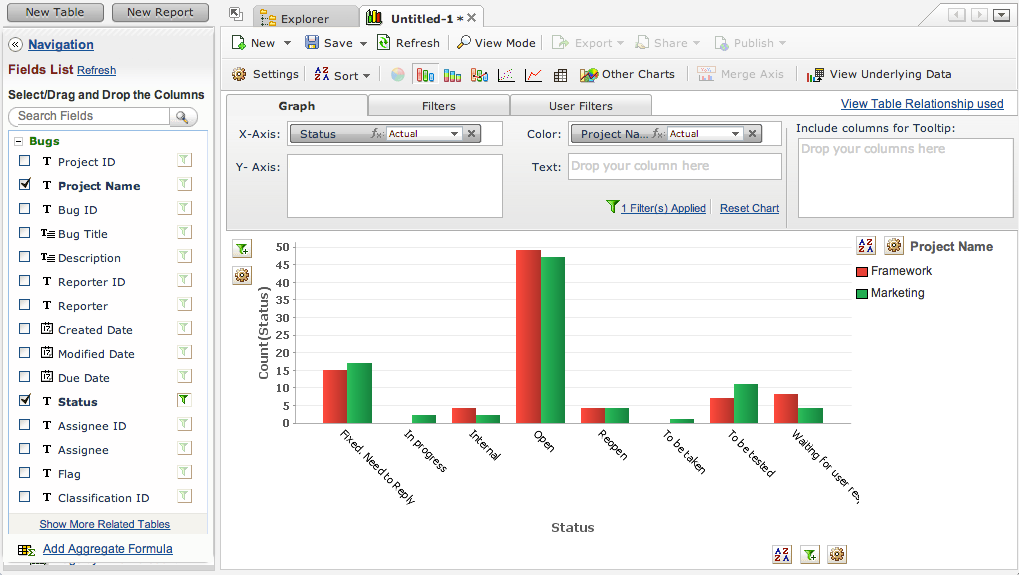
Jun
Jun. 6, 2014 | |
Support to Publish with Filter CriteriaZoho Analytics now supports Filter Criteria option while publishing the views. With this feature, you can apply a filter criteria to display the filtered data in your embedded view or published Permalink as needed. | |
Support to Share FolderNow Zoho Analytics provides an option to share the views in a folder. This will reduce the tedious work of selecting the views from the entire views list available in that database, when you share them. |
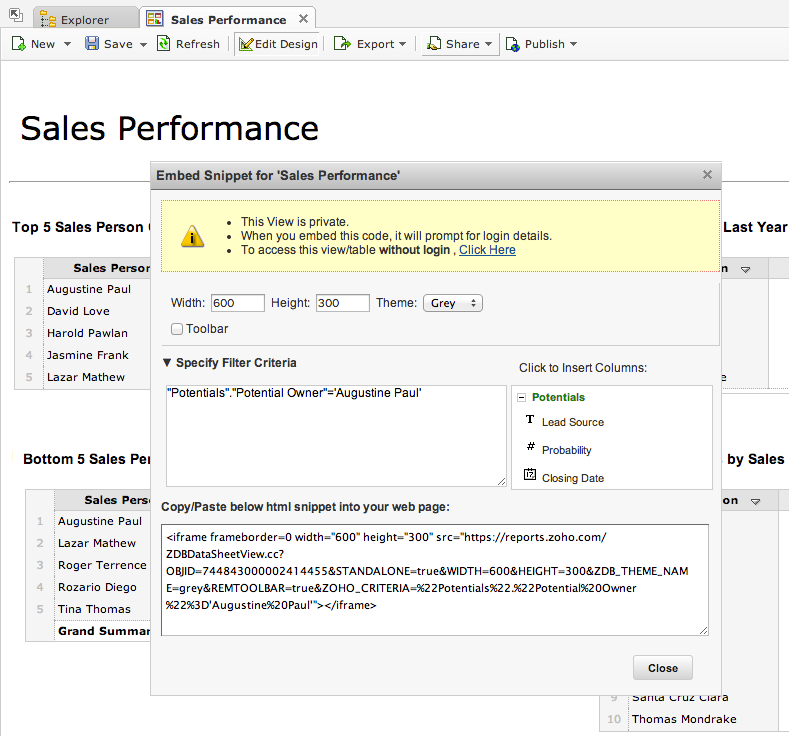
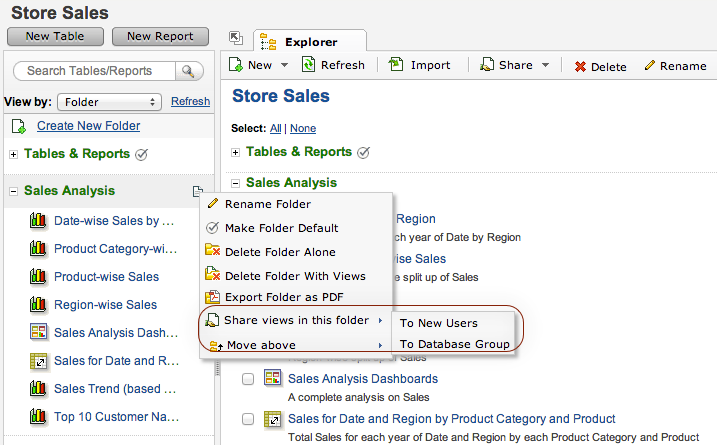
May
May 14, 2014 | |
Enable Reporting for NoSQL DatabasesZoho Analytics now enables you to analyze your data stored in NoSQL databases. You can connect and upload data from the following databases using Upload Tool and apply advanced reporting options in Zoho Analytics over your data.
To know how to upload data from your NoSQL databases, refer to the help section here. We have also tested connecting the following relational databases using Upload Tool through JDBC driver to enable data upload for reporting.
To know how to upload data from your Relational databases, refer to the help section here. | |
Amazon RDSSimilarly, you can now connect to databases hosted in Amazon RDS and upload the same into Zoho Analytics to enable reporting over the same. To know how to upload data from your database in Amazon RDS, refer to the help section here. |
May 27, 2014 | |
Support for Cases Modules in Advanced Analytics Add-on for Zoho CRMAdvanced Analytics Add-on for Zoho CRM now allows you to synchronize data from the Cases modules. With this, you can configure to synchronize data from Cases modules into Zoho Analytics Workspace. This module will be synchronized for all new users setting up the Advanced Analytics Add-on. Existing users can synchronize the newly supported module into Zoho Analytics by saving the setup again. For more details, refer here.
| |
Support to view Row Count in DatabasesZoho Analytics now displays the number of rows used in each of your Workspaces. You could view this from the Subscription page, in the Manage Users tab and View by Databases. This will be beneficial in managing your plan usage & upgrades proactively. |
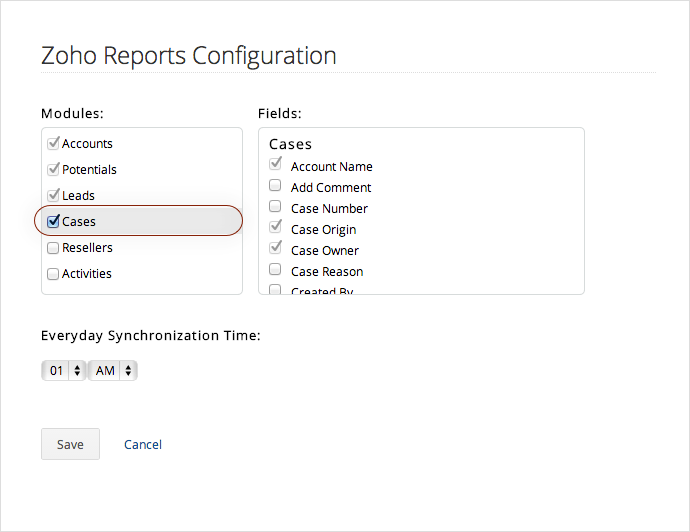
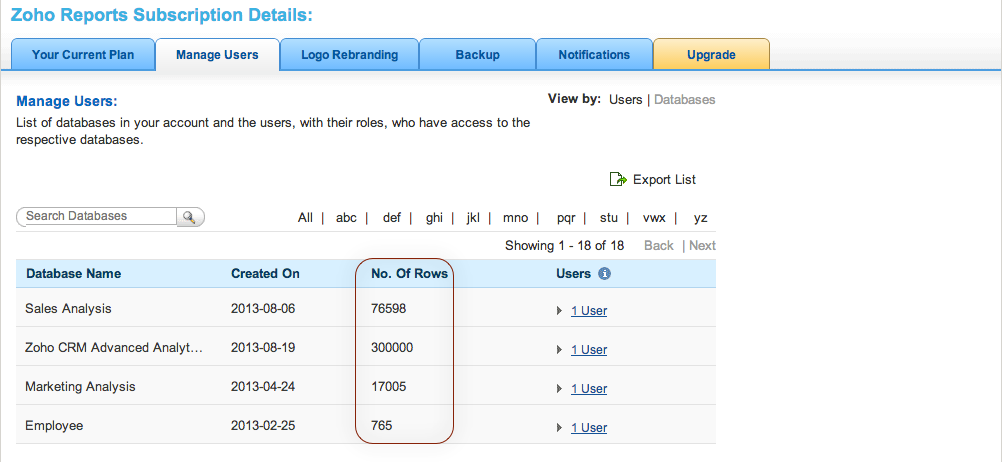
Apr
Apr. 10, 2014 | |
Enhanced Dashboard User FilterZoho Analytics Dashboard User Filter will now filters tabular data too. So far when you add a user filter for your dashboard, only data from Charts, Pivot Table and Summary View will be filtered. Now Tables, Query Tables and Tabular View included in the dashboard will also be filtered.
| |
Query Table Function EnhancementQuery Table now provides Interval support for the following functions. With this you will be able to add or subtract required time interval to your data column.
|
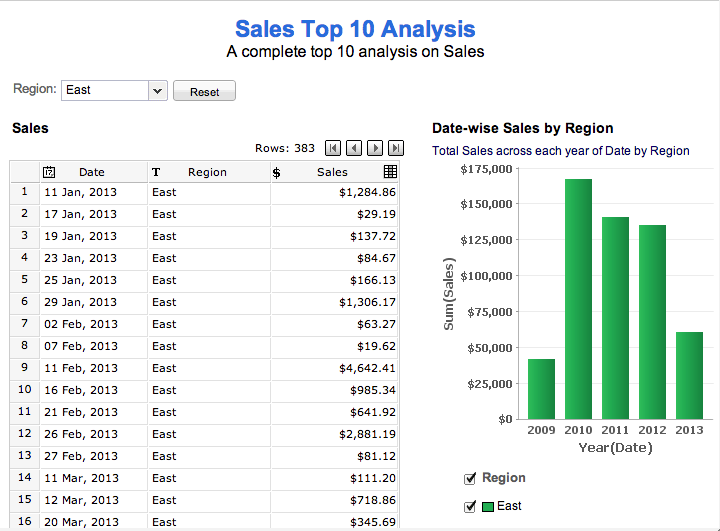
Apr. 22, 2014 | |
Enhancement for Pie and Funnel chartsThe following enhancements are available in the Pie and the Funnel Charts. | |
Multi Y SupportZoho Analytics now offers Multi Y Axes support. With this you will be able to compare data from multiple columns in Pie and Funnel.
| |
Customize Data LabelNow you will be able to set whether to display the percent or value as data label over the corresponding section. You could also choose to remove data label.This is available in the Settings option.
|
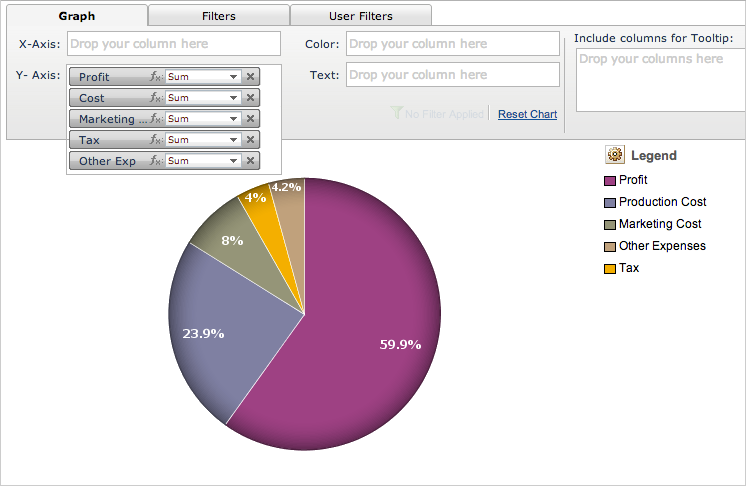
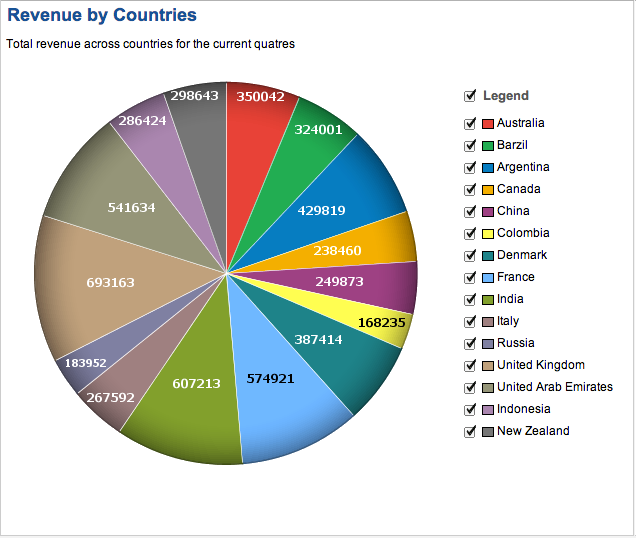
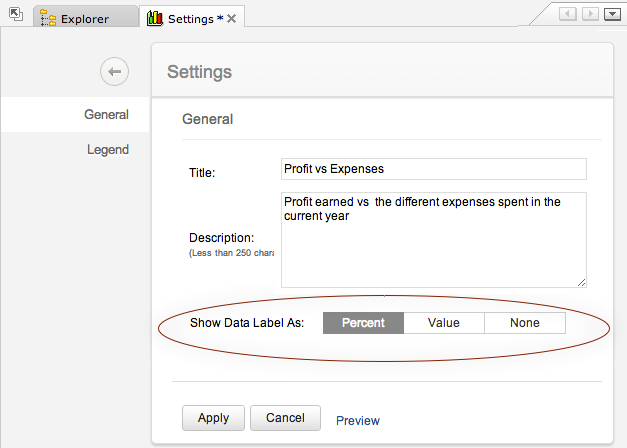
Mar
Mar. 11, 2014 | |
Support for Custom Modules in Advanced Analytics Add-on for Zoho CRMAdvanced Analytics Add-on for Zoho CRM now allows you to synchronize data from your custom modules. With this, you can configure to synchronize data from custom modules into Zoho Analytics for analysis and reporting.
| |
Support to Customize Pivot Table and Summary View LayoutZoho Analytics now offers an option to customize the Pivot and the Summary View layout. Now you could choose whether to display index number for the rows. Also you can resize all the columns to a uniform width by setting the default width to the columns. This option is available in the Settings dialog.
| |
Support to Sort LegendZoho Analytics now provides option to sort the legend items of a single - Y Axis chart. With this you will be able to set the order to display your legend items. You can avail this from the Chart Sort menu and by clicking the Sort icon available near legend in the Edit Design.
| |
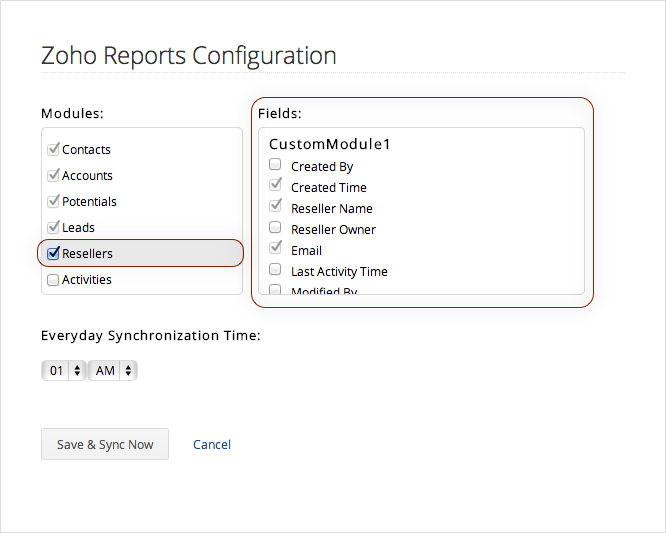
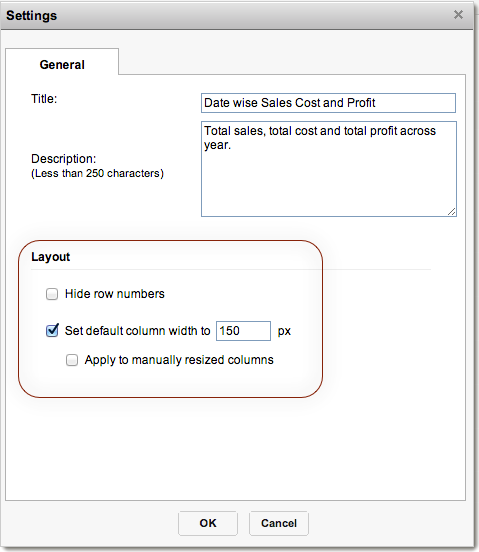
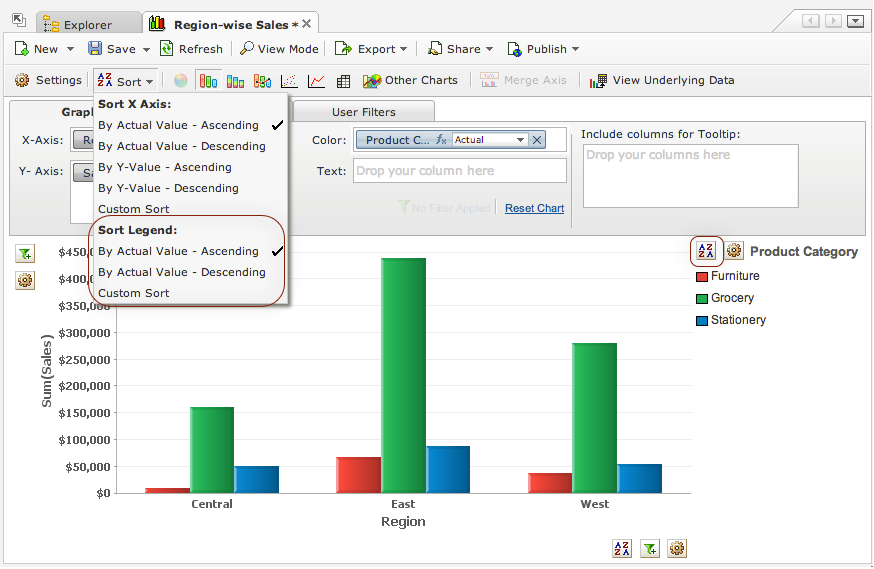
Mar. 25, 2014 | |
Changes in Advanced Analytics Add-on for Zoho ProjectsSupporting Bugs Module Advanced Analytics Add-on for Zoho Projects now allows you to synchronize data from your Bugs module. Users who have purchased the Bugs module in Zoho Projects, can choose to synchronize data from bugs module into Zoho Analytics for analysis and reporting. Also, we have added 20+ insightful reports & dashboards over Bugs module for your convenience. You can synchronize this by selecting the Bugs checkbox in the Import dialog. You could also choose to add this in the existing Workspace by editing the setup by clicking Zoho Projects Edit setup in the toolbar option. Timesheet Module Timesheet module is no longer a mandatory module to be synchronized. You could choose to include or exclude this from your Workspace as needed.
|
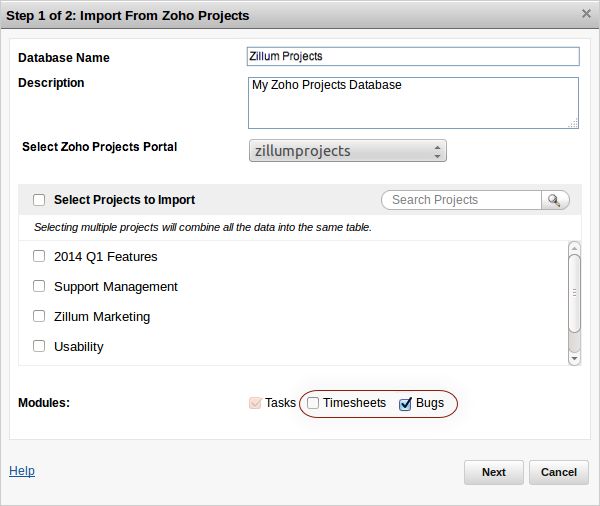
Mar. 28, 2014 | |
Account Usage NotificationNow Zoho Analytics allows you to configure mail notifications to monitor your account usage. This will notify you when your account usage crosses the threshold limits you have set for rows and users. This will be beneficial in managing your plan usage & upgrades proactively.
|
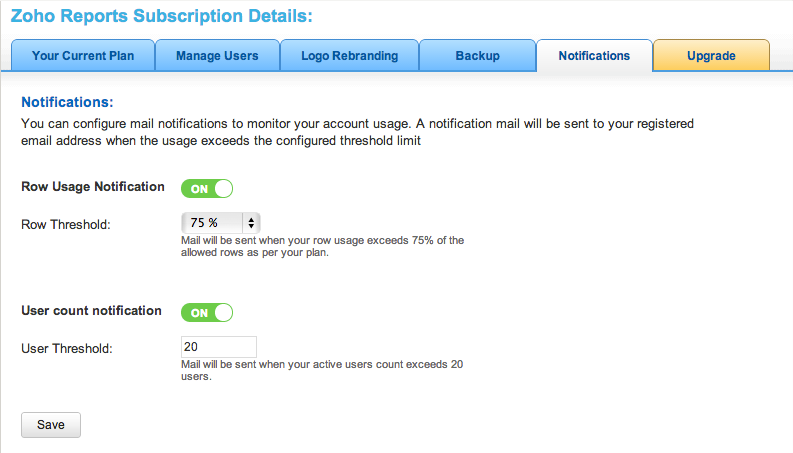
Feb
Feb. 21, 2014 | |
Support to Import from Cloud Storage/DriveZoho Analytics now allows you to import data from different Cloud Storage/Drive to start with your reports and analysis.
| |
Added Custom FormulaZoho Analytics now supports STR_TO_DATE function for creating custom formula to convert a text column with date into a date column. | |
Enhancement for White Label site Home DashboardThe White Label site home dashboard is been enhanced now. So far, views from a single database alone can be added in the home dashboard. Now you could configure to add views from multiple database as needed. Also, you could configure to display all the shared views of your users in their home dashboard. To get this configured for your White Label site write to us. We will get this done for you. |
Jan
Jan. 24, 2014 | |
Improvements in Lookup ColumnNow Zoho Analytics has enhanced the Lookup column feature by adding a new option to handle parent table data deletion. Setting this option will not delete (retain) the corresponding rows in the child table even when data is deleted in the parent table. Also enabling this option will provide much higher performance in data uploads into this table when compared to others options and hence its highly recommended. From now on this will be the default option. You could enable this option for the existing Lookup Columns using the Edit Lookup Setting option in column right-click menu.
| |
Enhancements to Multi-view ExportsThe following convenience options have been added for selecting views in Multi-view Export:
| |
More API SupportsZoho Analytics now supports the following APIs.
| |
Check out updates in: 2017 | 2016 | 2015 l 2014 l 2013 | 2012 | 2011 | 2010 | 2009 | 2008 | 2007